The Mudflap Violations view is populated based on the contents of Mudflap log file that you specified during the Launch Configuration setup. If the Mudflap log file is updated, the Mudflap Violation view automatically refreshes to reflect the modified data.
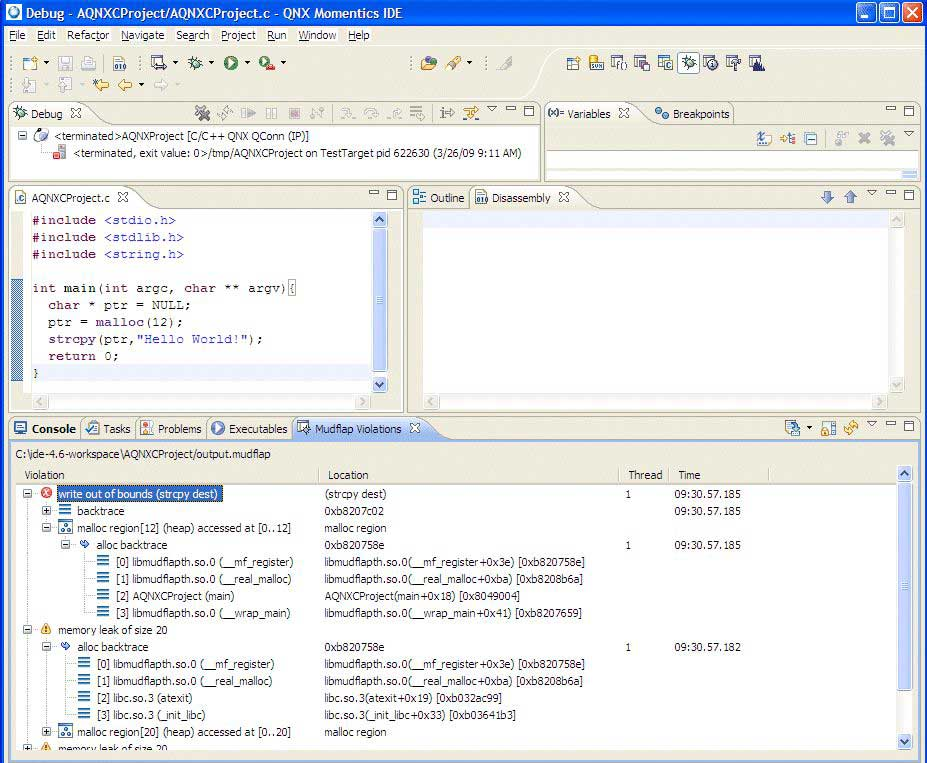
Figure 1. The Mudflap Violations view displaying data collected in the Mudflap log file.
Since Mudflap provides pointer debugging functionality, including buffer overflow detection, leak detection, and reads to uninitialized objects, the Mudflap Violations view will contain a comprehensive list of these errors (data from the output log). You can double-click an error to locate its corresponding source code.
Icons
| Icon | Name | Description |
|---|---|---|
|
|
Open Log | If a session view is not currently open, open or import a log file from the system or remote target. |
|
|
Scroll Lock | Prevent the view from refreshing the data currently displayed. |
|
|
Refresh | Perform a manual refresh to update the data in the view. |
|
|
Menu | The menu options for setting preferences for the Mudflap Violations view (Preferences), opening a Mudflap log file (Opening Mudflap Log…), and locating a specific error or object. |
If you double-click on an item in the view, you'll obtain the source navigation for that item.
If you click a column heading, the data in the list is sorted according to the column you selected.
The main view shows the unique errors, and if you expand a particular violation, you'll receive information about nearby objects, a backtrace, similar errors, as well as other detailed information.
For a description about the errors returned by Mudflap, see Interpreting Mudflap output.