You can also examine your program as it steps into functions that you don't have
source code for, such as printf(). Normally, the debugger steps over these
functions, even when you click Step Into. When the instruction
pointer enters functions for which it doesn't have the source, the IDE shows the
function in the Disassembly view.
To show the Disassembly view:
-
From the menu, choose .
The workbench adds the Disassembly view to the Debug perspective:
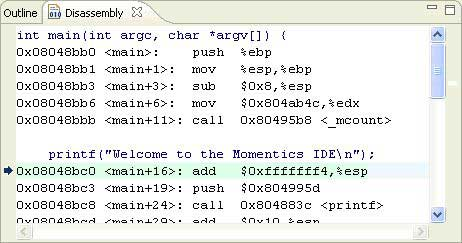
The Disassembly view lets you examine your program as it steps into functions.
-
If you click in this view or use the Toggle Instruction
Stepping icon to give focus to this view, the operators (e.g.
Run to Line) operate on machine instructions instead of the source code:
