- Right-click your target in the Target Navigator view, and then choose from the menu.
-
Select System Information Logging Configuration, and then select the New launch configuration icon (
 ) to create a Log configuration.
-
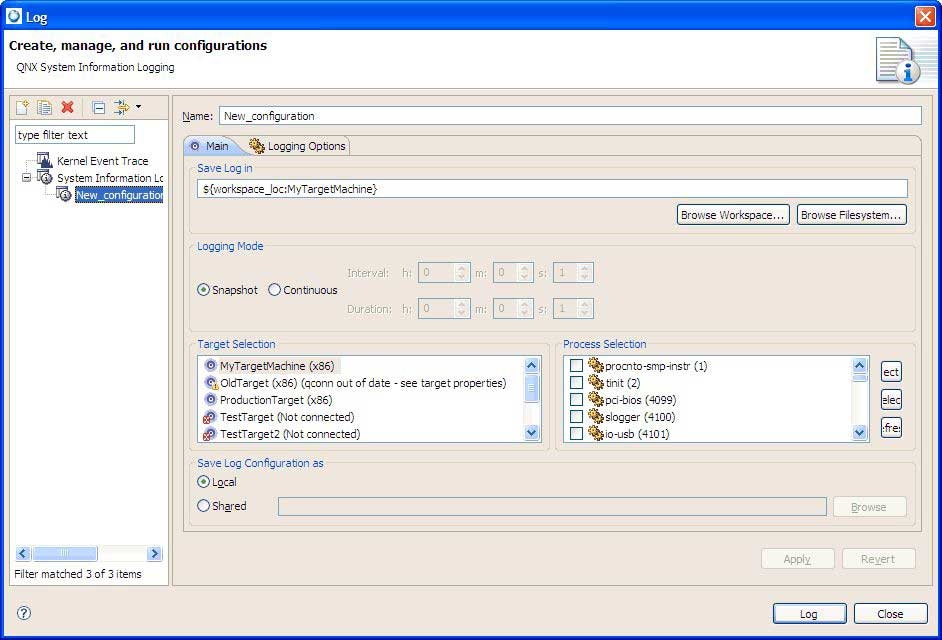
On the Main tab of the log configuration, select the location where you'd like to store the log file.
-
Select the mode to use:
- Snapshot mode collects all the requested data, and then stops.
- Continuous mode collects the data, and then continues to collect any changes to the data for the requested period of time at an interval provided (the default is 1 second).
- Select the Neutrino target and any processes you want to collect data for.
- If you wish, select the Logging Options tab and select the level of information you require.
- Select Log.
Here are a few things to consider when setting up your log configuration:
- In order to log some types of data, you need to log, monitor, or include other types of data. For example, if you want to collect any of the process-level data, you must select Processes in the list of system-level data. Similarly, if you want to collect thread-level data, you must select Threads in the list of process-level data.
- If you select specific processes for logging, the IDE doesn't log process data for any new processes that are created by the logging session (e.g. process IDs show as -1). If you wish to log all processes, including those created during the logging operation, don't select any processes in the process-selection area on the Main tab of the log configuration.
Viewing captured system information
Once the logging process has begun, you'll see a progress monitor for it in the Progress view and the lower right progress area of the main IDE window. You can cancel the logging at any time through the Progress view.
When the logging operation finishes, the IDE presents the captured data as a target in the System Information History View. This view behaves the same way as the Target Navigator view; selecting the target or one or more processes causes the System Information views to show the corresponding data from the log.
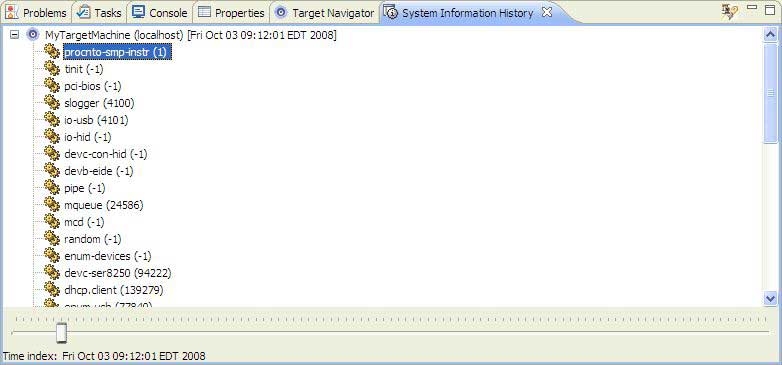
To view the data captured over a period of time in continuous mode, drag the time index slider at the bottom of the System Information History view to the point in time where you'd like to view the data; the views update to show the data at that point in time.
To view a log file from a previous logging session, select the Search log files button ( ) in the toolbar area of the System Information History view. This presents you with a dialog showing a list of the log files
that the IDE has found:
) in the toolbar area of the System Information History view. This presents you with a dialog showing a list of the log files
that the IDE has found:
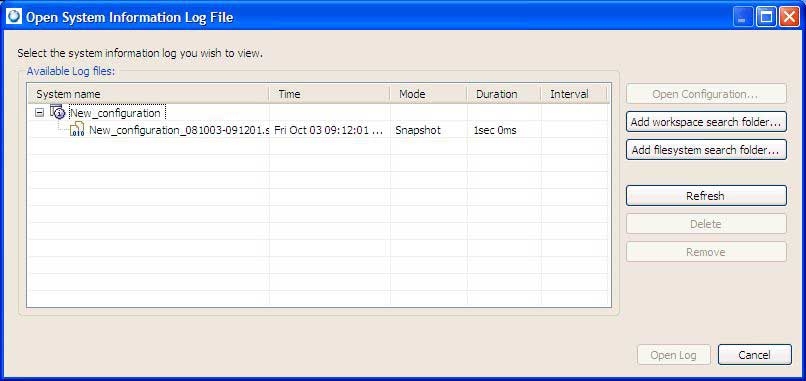
In the Open System Information Log File dialog, you can set search paths for the IDE to use to find log files, and you can load these log files into the System Information perspective. By default any existing log configurations that you've used to gather information are shown. To load a log file, select it in the tree, and then select Open Log. When the file is loaded, the data from the log file appears as a target in the System Information History view.