To test a running process for memory leaks:
- In the System Information perspective, select the process to examine.
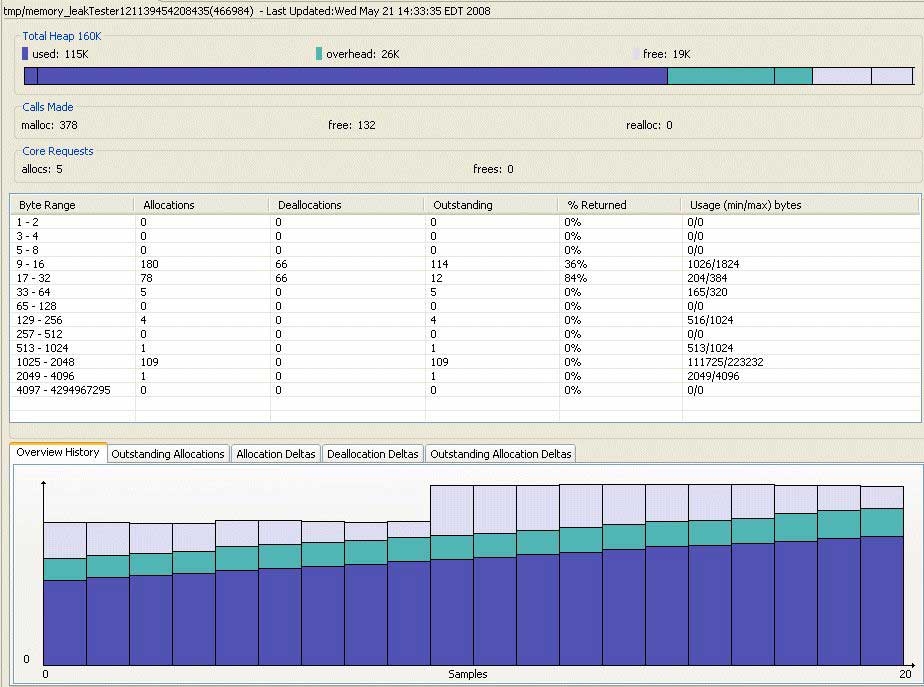
- Switch to the Malloc Information view to compare memory usage at specific times.
- Watch the Outstanding column and observe the value to see if it increases, or watch the graph in the Overview History tab.
In the example below, notice the steady growth in the chart. If the memory usage continues to increase over time, then the process is not returning some of the allocated memory.
Since memory leaks can be apparent or hidden, to know exactly what's occurring in your application, use the Memory Analysis tool to automatically find the apparent memory leaks type. A memory leak is considered apparent when the binary address of that heap block (marked as allocated) isn't stored in any of the process memory and current CPU registers any longer.