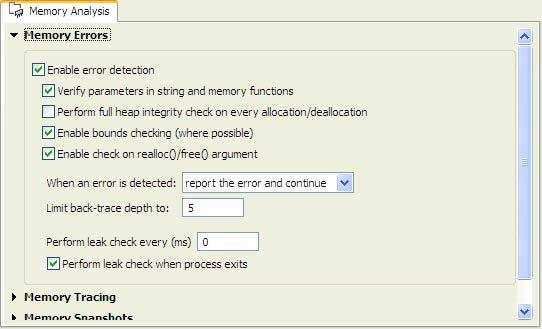
Memory errors can occur if your process corrupts the memory or tries to free the same memory twice, or uses a stale or invalid pointer. These silent errors can cause surprising, random application crashes. The source of the error can be extremely difficult to find, because the incorrect operation could have occurred in a different section of code long before an innocent operation triggered a crash.
To learn more about the common causes of memory problems, see Heap Analysis: Making Memory Errors a Thing of the Past chapter of the QNX Neutrino Programmer's Guide.
To detect a memory error, you should launch your program with the Memory Analysis tool enabled.
Memory Analysis tooling consists of IDE Visualization tools and a runtime library called librcheck.so. The library overrides the allocator and standard str* and mem* functions to insert trace collection and runtime correctness checks. You don't need to re-compile you program to enable error detection; the library can be pre-loaded at runtime if you're running your program with Memory Analysis enabled.
To enable memory analysis:
- From an existing launch configuration, select the Tools tab.
- Select Add/Delete Tool.
- Select Memory Analysis and click OK.
- Select desired options for the tool.

- Select the Switch to this tool's perspective on launch' option.
- After enabling Memory Analysis in a launch configuration, run that configuration.
There are a few other ways to enable memory analysis, including attaching to a running application or postmortem analysis. For more information about these and other launch options, see Launch your program with Memory Analysis.
After you configure the IDE for memory analysis, you can begin to use the results to identify memory errors in your programs, and then trace them back to your code.
To view the memory errors identified by the IDE:
- Switch to the Memory Analysis perspective.
- In the Session view, click your desired launch configuration.

The Memory Problems view will open.
- From the problems list, select a problem.
Notice that the information in the Memory Backtrace view dynamically updates to reflect the error that you've selected.
- Double-click on an error or backtrace line to navigate to that error in the code editor.
- Modify the code, as required, to correct the memory error for the selected problem.
For more information about how to interpret memory errors during memory analysis, see Interpret errors during memory analysis later in this chapter.