You can perform memory analysis on a running program, or you can log the trace to a file on the target system. The advantage of logging the trace is that doing so frees up qconn resources; you run the process now, and perform the analysis later. Also, if your target is not connected to the network, it's the only way you can do memory analysis.
- To start the program from command line, see Launch from the command line with Memory Analysis enabled.
- Copy the file back to the host, then right-click inside the Session view and click Import.
An Import dialog is displayed:
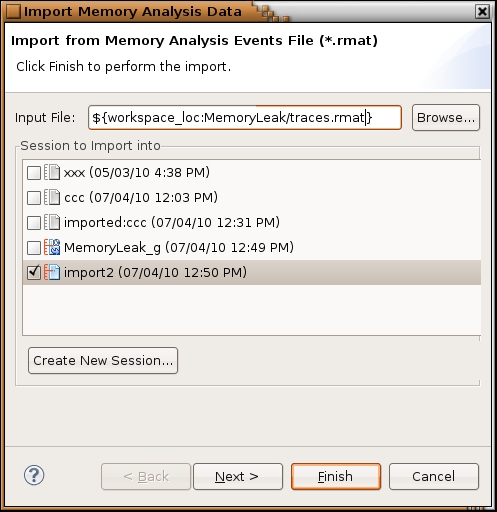
- Choose an existing session, or click Create Session to create a new one. If you choose an existing session, the data would be merged.
- Browse to the file that you copied from the target, and then click OK. The IDE will parse the file for viewing.
The memory analysis session would be created and populated with the data, click on session to start the analysis, see View Memory Analysis data.
For the supported options of the rcheck library, see the summary of Memory Analysis Tool (MAT) graphical user interface options (flags) and their corresponding environment variables at GUI interface options and environment variables for the Memory Analysis Tool.