-
Change to the Debug perspective if it is not currently open.
The first thing you will notice is that the target board has been automatically restarted. After waiting a certain number of seconds as specified in the Reset and Delay (seconds) checkbox on the Startup tab of the Debug launch configuration, the QNX Momentics IDE will begin uploading the image to the target through the JTAG pins.
After the image has been successfully uploaded, startup will commence until it hits a breakpoint.
Once the IDE encounters a breakpoint, you will see several things at once. In the top-left portion of the Debug perspective, you will see a stack trace for the current location of the code.
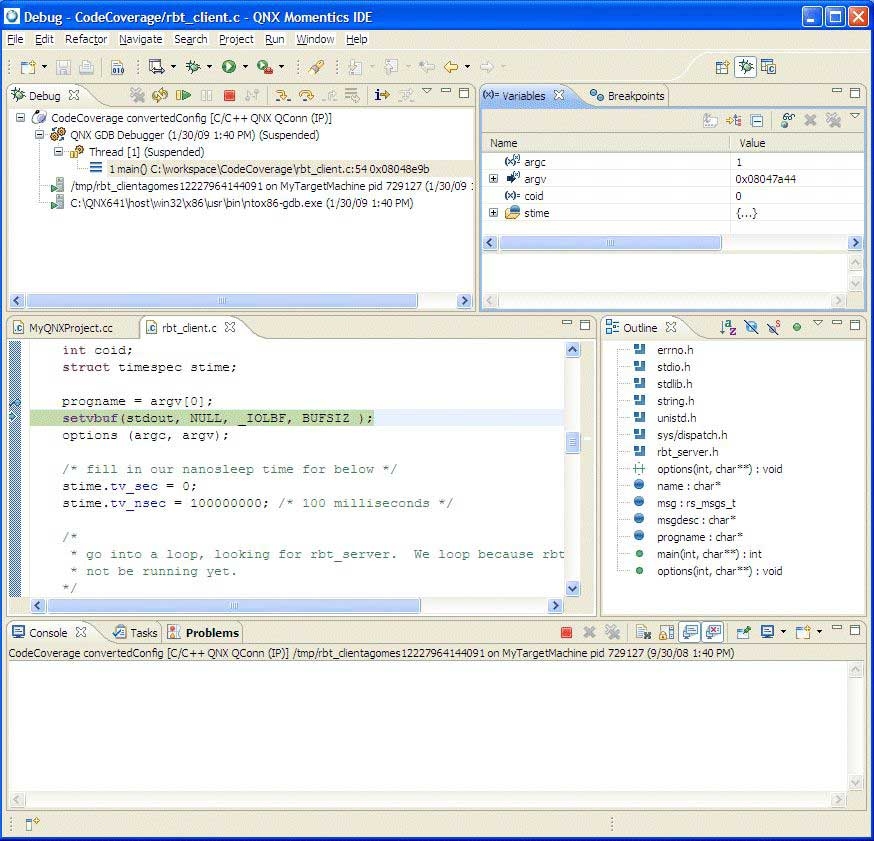
In your debug results, it might appear to be more shallow than the stack traces that you would typically see because the code is not running in a complicated environment, but rather directly on the hardware.
You can use the Registers view to expand and show all of the processor registers on your target board, and their contents over time. While stepping through, register rows will change color to indicate a changed value.
You can also select the Variables tab to view the value of local and global variables for which symbols exist, and you'll see the Code view and Disassembly view. The Disassembly view will incorporate the source code into its display, allowing you to easily see which machine instructions correspond to which lines of code.
- In either the Code view or the Disassembly view, you can set and remove breakpoints by double-clicking on the margin. You can use the Step and Continue tools at the top of the screen to resume execution.
Once you've finished your debugging session, you should remove all breakpoints and click Continue to let startup finish booting up. A quick look at the serial console will show a fully-booted Neutrino image.
The following topics discuss the process of installing, configuring, and using the Lauterbach Trace32 In-Circuit Debugger with a QNX Neutrino kernel image, as well as describing the steps necessary to debug using the Debugger:
- Prerequisites
- Install the Lauterbach Trace32 In-Circuit Debugger software
- Install the Lauterbach Trace32 Eclipse plug-in software
- Connect the Lauterbach Trace32 In-Circuit Debugger
- Configure the Lauterbach Trace32 In-Circuit Debugger
- Create a launch configuration for the target hardware
- Createa startup script for the Lauterbach Trace32 In-Circuit software
Currently, the Lauterbach TRACE In-Circuit Debugger doesn't integrate with gdb.
The JTAG integration in the IDE is limited to source-level debugging of the source code only.
Since the Lauterbach Trace32 In-Circuit Debugger doesn't support Neutrino hosts, your host must run with a Microsoft Windows, Linux, or Mac OS.
The proper powering-up/down sequence is to power up the debugger first, and then the target, and the powering-down sequence is to power down the target, and then the debugger.
When prompted to specify a directory location, if you don't want to use the default directory specified, we recommended that you not use the system directory itself.
The IDE contains built-in support for the Abatron BDI2000 and Macraigor USB2Demon JTAG devices, with other device support through self-defined hardware-specific command sets.
The JTAG debug launch configuration supports GDB Hardware Debug through the JTAG interface.
For more information about the Lauterbach Trace32 In-Circuit Debugger, see the Lauterbach documentation and refer specifically to the ICD Debugger User's Guide, ICE User's Guide, and ICE User's Guide. Descriptions for all of the general commands are found in the IDE Reference Guide and General Reference Guide.