The QNX Neutrino System Analysis Toolkit (SAT) consists of the following main components:
- instrumented kernel
- kernel buffer management
- data-capture program (tracelogger)
- data interpretation (traceprinter)
You can also trace and analyze events under control of the Integrated Development Environment (IDE).
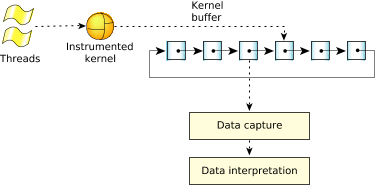 Figure 1. Overall view of the SAT.
Instrumented kernel
The QNX Neutrino instrumented kernel includes a small, highly efficient event-gathering module. As threads run, the instrumented kernel module continuously intercepts information about what the kernel is doing, generating time-stamped and CPU-stamped events that are stored in a ring of buffers. Because the tracing occurs at the kernel level, the SAT can track the performance of all processes, including the data-capturing program.
Kernel buffer management
The kernel buffer is composed of many small trace buffers. Although the number of buffers is limited only by the amount of system memory, it's important to understand that this space must be managed carefully. If all of the events are being traced on an active system, the number of events will be quite large.
To allow the instrumented kernel to write to one part of the kernel buffer and store another part of it simultaneously, the trace buffers are organized as a ring. As the buffer data reaches a high-water mark (about 70% full in linear mode, or 90% in ring mode), the instrumented kernel module raises an _NTO_HOOK_TRACE synthetic interrupt to notify the data-capture program, passing the index of the buffer. The data-capture program can then retrieve the buffer and save it in a storage location for offline processing or pass it to a data interpreter for runtime analysis. In either case, once the buffer has been emptied, it's once again available for use by the kernel.
Data-capture program (tracelogger)
The QNX Neutrino RTOS includes a utility, tracelogger, that you can use to capture data. This service receives events from the instrumented kernel and saves them in a file or sends them to a device for later analysis.
Because the tracelogger may write data at rates well in excess of 20 MB/minute, running it for prolonged periods or running it repeatedly can use up a large amount of space. If disk space is low, erase old log files regularly. (In its default mode, tracelogger overwrites its previous default file.)
You can also control tracing from your application (e.g., to turn tracing on just for a problematic area) with the TraceEvent() kernel call. This function has over 30 different commands that let you:
- create internal trace buffers
- set up filters
- control the tracing process
- insert user-defined events
For more information, see the “Capturing Trace Data” chapter in this guide, the entry for tracelogger in the Utilities Reference, and the entry for TraceEvent() in the C Library Reference.
Data interpretation (traceprinter)
We provide a utility, traceprinter, that outputs the trace events stored in a kernel event file generated by tracelogger. These events are ordered linearly by their timestamp as they're emitted by the kernel. You can also use the utility to do the following offline or in real time:
- perform analysis
- display results
- debug applications
- create a self-monitoring system
- show events ordered by process or by thread
- show thread states and transitions
- show currently running threads
The utility uses the libtraceparser library. This library provides traceparser_*() functions for parsing and interpreting the trace events stored in the kernel event file. Specifically, the library lets you easily:
- set up callback functions and associations for each event
- retrieve header and system information from the trace event file
- debug and control the parsing process
For more information, see the “Interpreting Trace Data” chapter in this guide, as well as the entry for traceprinter in the Utilities Reference.
Integrated Development Environment (IDE)
The QNX Momentics IDE provides a graphical interface for capturing and examining trace events. The IDE lets you filter events, zoom in on ranges of them, examine their data, save subsets of events, and more. For details, see the “Analyzing System Behavior” chapter of the IDE User's Guide.