General Statistics
This view provides event statistics for all displayed owners or the selected ones. The statistics include aggregate data about the times spent in each state and the number of non-state events of each type.
- No trace data are displayed until you click the Refresh statistics button (
 );
some views have a different name for this button but it does the same thing.
Note:If you're viewing statistics from one kernel event log file but then open another log file, the results in the statistics-related views won't reflect the newly opened file until you refresh them manually.
);
some views have a different name for this button but it does the same thing.
Note:If you're viewing statistics from one kernel event log file but then open another log file, the results in the statistics-related views won't reflect the newly opened file until you refresh them manually. - They can display statistics that reflect either the entire trace period or the timeframe selected in an editor pane.
The display mode is controlled by the Toggle global/selection statistics gathering button
(
 ) as well as the top option in
the upper right dropdown (
) as well as the top option in
the upper right dropdown ( ).
). - They can generate a CSV report of the data currently displayed. This feature is accessed through the bottom option in the upper right dropdown.
The data shown in General Statistics are calculated from only those events belonging to owners currently displayed in the Timeline pane; which owners are displayed depends on any filters you've applied. Unlike with some other System Profiler views, there's no button to turn the filtering on or off for the table data—the data are always synchronized with the filters.
- States — This left table provides statistics about state entry events, including the number of occurrences and the average, maximum, minimum, and total duration in each state.
- Events — This right table displays the number of occurences for non-state events that marked a new task involving the kernel, such as a message send, mutex locking, or condvar signalling.
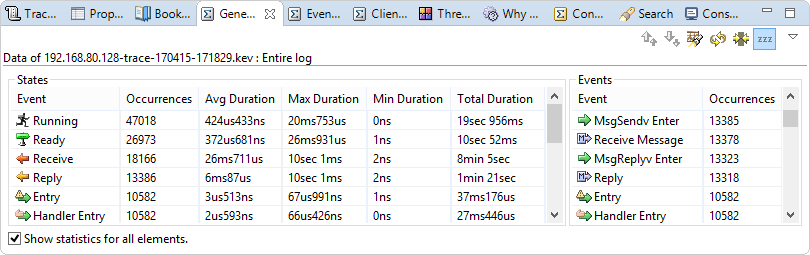
Initially, the Show statistics for all elements box (at the bottom) is checked, so the table data represent all displayed owners. But you can uncheck the box to see data from only those that are selected, meaning their timelines are highlighted in grey. This option provides a second level of filtering.
In the States table, you can right-click in a row and from the context menu, navigate directly to
the events that mark the beginning of the maximum and minimum times in that state. In the Timeline pane, the IDE moves
the yellow arrow marker to the matching event's tick mark and draws thin red circles around this tick mark and those of
all other events of the same type, for all displayed owners.
Note that there are equivalent buttons, Go to maximum duration
(![]() ) and Go to minimum duration
(
) and Go to minimum duration
(![]() ) in the view toolbar.
) in the view toolbar.
After selecting a row in either table, you can click the Search for selected events button
(![]() ) to search for all events of the same type within the
displayed owners. The IDE then switches to the Search view, which lists the results up to a maximum of 1000 entries.
Note that the Events table makes this same feature available through the right-click menu.
) to search for all events of the same type within the
displayed owners. The IDE then switches to the Search view, which lists the results up to a maximum of 1000 entries.
Note that the Events table makes this same feature available through the right-click menu.
Finally, the toolbar has one more button: Include idle threads
(![]() ).
When this option is selected, the table data reflect the time spent in idle threads. By default, this is unselected.
).
When this option is selected, the table data reflect the time spent in idle threads. By default, this is unselected.