Event Owner Statistics
This view displays per-owner event statistics, including event counts and how much time owners spent in specific states.
Every statistics view in the System Profiler perspective has these common behaviors:
- No trace data are displayed until you click the Refresh statistics button (
 );
some views have a different name for this button but it does the same thing.
Note:If you're viewing statistics from one kernel event log file but then open another log file, the results in the statistics-related views won't reflect the newly opened file until you refresh them manually.
);
some views have a different name for this button but it does the same thing.
Note:If you're viewing statistics from one kernel event log file but then open another log file, the results in the statistics-related views won't reflect the newly opened file until you refresh them manually. - They can display statistics that reflect either the entire trace period or the timeframe selected in an editor pane.
The display mode is controlled by the Toggle global/selection statistics gathering button
(
 ) as well as the top option in
the upper right dropdown (
) as well as the top option in
the upper right dropdown ( ).
). - They can generate a CSV report of the data currently displayed. This feature is accessed through the bottom option in the upper right dropdown.
Each row in the Event Owner Statistics table shows data for one owner, with its name given in the
leftmost column. The total events and number of kernel calls are given in the next two columns, while the remaining ones
list the state times for a configurable set of states. By default, the table shows the times spent in these states:
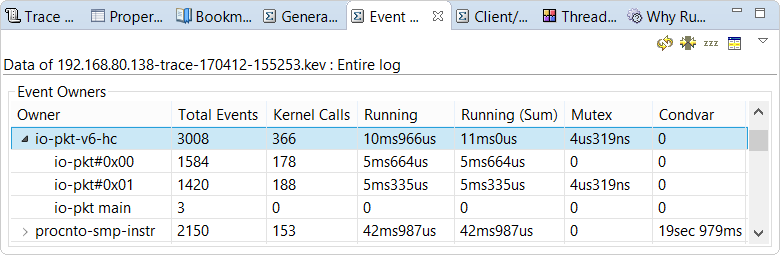
- Running — For processes, the total time within the trace when at least one of their threads was running. The Process & Thread Activity description for the Summary pane explains how this metric is calculated. For threads, their total time executing on a CPU.
- Running (Sum) — For processes, the sum of their thread runtimes. This column can vary from the last one only for processes on multiprocessor or multicore systems. For threads, these two metrics are the same. Again, more details are given in the Process & Thread Activity description.
- Mutex — Total time blocked on a mutual exclusion lock (i.e., inside pthread_mutex_lock() calls).
- Condvar — Total time blocked on a condition variable (i.e., inside pthread_cond_wait() calls).
The view toolbar has two other buttons:
- Include idle threads (
 ) —
When selected, the table data reflect the time spent in idle threads. By default, this is unselected.
) —
When selected, the table data reflect the time spent in idle threads. By default, this is unselected. - Synchronize with editor filters (
 ) —
When selected, the table shows data from only those owners specified in the
Filters view. By default, this is unselected.
) —
When selected, the table shows data from only those owners specified in the
Filters view. By default, this is unselected.
The view dropdown has two additional options:
- Flatten event owners — When selected, no summary rows for interrupts and processes are shown; instead, only rows for interrupt handlers and threads are displayed in a flat list format. This setting is off by default, so initially, you see only interrupt and process entries, which you must expand to see individual handlers and threads. In the previous screenshot, the io-pkt-v6-hc process is expanded to reveal the data for its threads.
- Configure Table — Opens a window for picking the states for which you want to see time data in the table.
Page updated: