Isolating client and server CPU loads
Heavy CPU usage can often be traced to server activity. Sometimes, a server doesn't need to be optimized but its client activity needs to be examined closely to see how much server time is accumulating based on client requests.
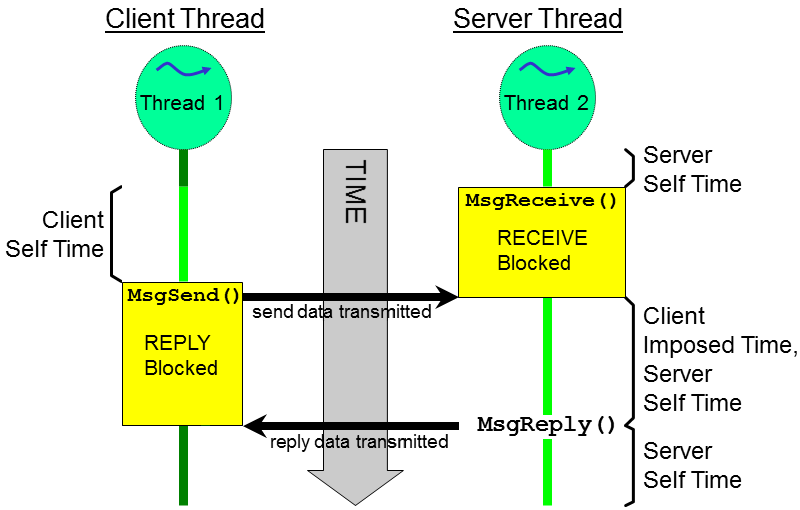
The primary IPC mechanism in QNX Neutrino systems is message passing. The System Profiler uses message-passing events in the kernel event trace log to identify clients and servers when measuring their CPU times. Threads in client processes send messages to threads in server processes to ask them to perform work on their behalf. To understand why a target machine might be heavily loaded, you therefore need statistics on how much server work is imposed by individual clients.
We use the term self time to mean that a thread is directly executing (i.e., doing something for itself). This applies to clients and servers. Imposed time means that a thread is indirectly executing (i.e., another thread is doing something for it). This applies only to clients, because servers sometimes execute on their behalf.
You can use the Toggle global/selection statistics gathering button
(![]() ) to show time values based on the entire
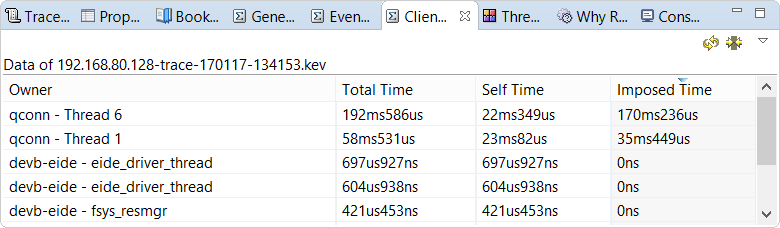
trace period or the selected timeframe only. This way, you can find which clients create the most work for servers. To easily
spot these clients, click the Imposed Time header once to sort the table by this metric in descending
order.
) to show time values based on the entire
trace period or the selected timeframe only. This way, you can find which clients create the most work for servers. To easily
spot these clients, click the Imposed Time header once to sort the table by this metric in descending
order.
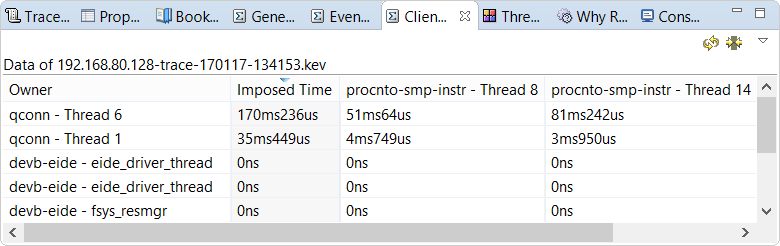
Here, qconn Thread 6 is imposing a heavy load on procnto-smp-instr Thread 8 and procnto-smp-instr Thread 14. This makes sense because qconn must communicate with the kernel to extract information about the system state and all proceses and threads. If we were to examine the Total Time values (hidden in this screenshot) for these same kernel threads, we would find they're less than that for the qconn thread. This is because the QNX Neutrino microkernel is a pure server process, meaning it consumes no CPU resources without being asked to do some work.
When you've identified the clients with the longest imposed times, you can redesign the affected applications to reduce the number of requests sent or even the number of client threads. This could involve, for example, making clients store copies of data locally to avoid querying servers as often.