Valgrind Cachegrind simulates cache memory and measures a program's reads and writes and its misses at various cache levels.
It also reports branch misprediction rates. Cachegrind writes these statistics into the analysis results, which the
IDE then parses to display performance data.
Note:
All Valgrind tools can be loaded and run
from the command line.
However, using the IDE is more convenient because it automates much of the setup by setting Valgrind command options
based on UI fields and by copying the analysis results into the host workspace.
To measure cache statistics with Valgrind Cachegrind:
-
In the launch bar, expand the Launch Configuration dropdown (which is in the middle) and select the project
for which you want to analyze cache usage.
-
In the Launch Target dropdown (on the right), select the target for running your application.
-
In the Launch Mode dropdown (on the left), select Memory.
-
Click the Edit button (
 )
on the right of the Launch Configuration dropdown.
)
on the right of the Launch Configuration dropdown.
-
In the configuration editor window, access the Valgrind controls by clicking the Memory tab
on the right and then the Valgrind radio button near the top of this tab.
-
Select Cachegrind from the Tool to run dropdown.
- Optional:
You can change any settings to customize what gets reported in the Valgrind results.
The Cachegrind tab lets you
enable and disable the collection of certain statistics and set the properties of the simulated caches.
-
Click OK to save the configuration changes and close the window.
-
In the launch bar, click the Memory button
(
 ).
).
The IDE switches to the QNX Analysis perspective. If necessary, the IDE first builds the binary before uploading it
to the target. To analyze the application, the IDE instructs Valgrind to execute the uploaded binary with Cachegrind
instrumentation. Then, it creates a session for storing the Valgrind results; this new session is displayed in the
Analysis Sessions view. When the program terminates, Valgrind writes the results to a log file,
which the IDE copies into the directory area for the new session.
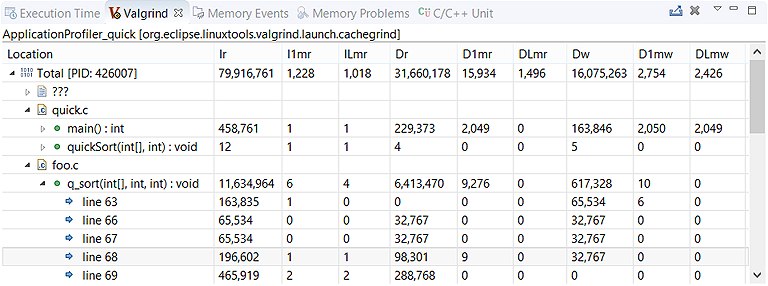
In the
Valgrind view, the collected cache statistics are displayed in a table.
The top row displays the PID of the Valgrind process in which the analyzed program ran, followed by the total reads,
writes, and misses for the first and last cache levels. The rows underneath display per-function statistics.
You can click the arrow on the left of a source file's name to see the cache reads, writes, and misses for each function
in that file:
Double-clicking any function row opens the source code to the corresponding line.
Note:
You can run multiple Valgrind sessions concurrently, using the same tool or different tools, on the same application or
different applications. Valgrind log files always contain the PIDs of the Valgrind processes, so their names are always
distinct.