You can use the Timeline State Colors view () if you're unfamiliar with the System Profiler timeline editor pane state colorings, or if you'd like to change the color settings to something more appropriate for your task.
The view displays a table with all of the color and height markers that are used when
drawing the timeline display. These settings can be bulk imported and exported using the
view's dropdown menu based on particular task requirements. The default settings
generally categorize states with similar activities together (synchronization, waiting,
scheduling, etc.).
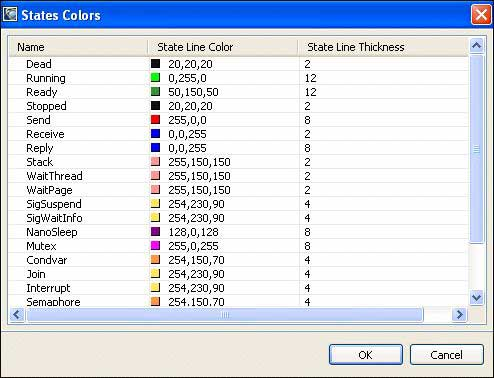
Figure 1. The System Profiler's Timeline State Colors view
Figure 1. The System Profiler's Timeline State Colors view