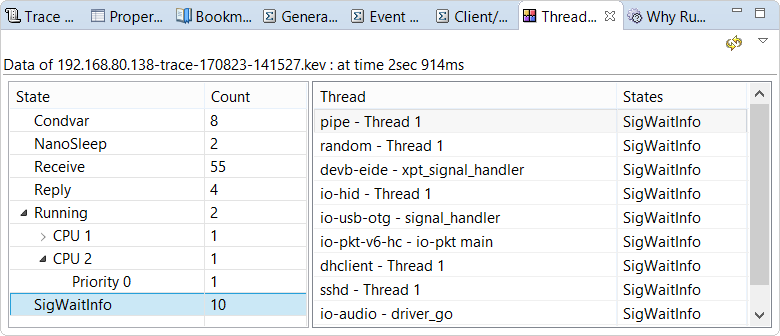
This view shows you the states that various threads were in at a given point during the trace. This information helps you understand what the system was doing at that time.
The contents of the view are based on the current selection in the Timeline pane.
After you click an event in this editor pane, you must then click the Refresh icon
(![]() )
in the Thread State Snapshot view's toolbar to update the contents of this view.
)
in the Thread State Snapshot view's toolbar to update the contents of this view.
Two tables are shown. The first table lists the thread counts for all states. For the Running state, you can click the arrow next to its label to see the thread counts for individual CPUs on the target system. You can then click the arrow next to a CPU label to see the thread counts for specific priority levels. Meanwhile, the second table lists the names of the threads in the states currently selected in the first table. Note that you can use multi-select in the first table to list the threads for multiple states.
By default, the tables are stacked horizontally, but you can select Vertical View Orientation
from the view's dropdown menu (![]() )
to stack them vertically, with the state count table appearing above the thread names table.
To restore the default display, choose Horizontal View Orientation from the dropdown menu.
)
to stack them vertically, with the state count table appearing above the thread names table.
To restore the default display, choose Horizontal View Orientation from the dropdown menu.