The Timeline pane in the System Profiler editor provides a detailed view of all elements in the trace, by showing the timing of all events associated with them.
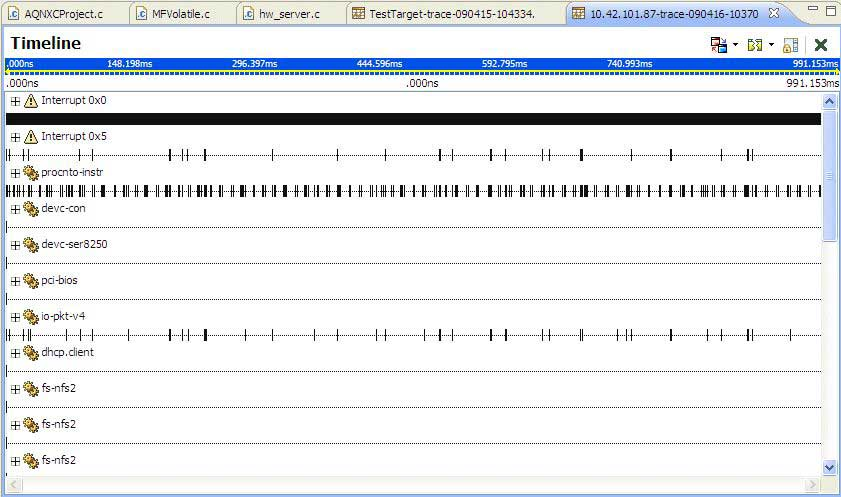
Figure 1. The System Profiler's Timeline pane
The Timeline also serves to populate many of the other panes and views within the System Profiler. Several other panes and views repopulate their data based on the selection in the Timeline.
You can click the plus sign (+) next to process names to show individual threads. Clicking the name of a process or thread selects it so you can perform operations on it. Use SHIFT–CTRL for multiselect.

Figure 2. A Timeline drawer for a thread
You can zoom the timeline using the toolbar menu actions or shortcut keys. The range shown at the top of the timeline illustrates which portion of the log file is currently displayed, relative to the full file. To zoom in, select the timeline range you want to magnify and the timeline will enlarge accordingly.
The scrollbar above the shaded area allows you to quickly modify which portion of the trace is being displayed. By dragging the scrollbar left or right, you can update the shaded area along with the end points in the header of the Processes and Threads section; this section updates when you release the scrollbar.
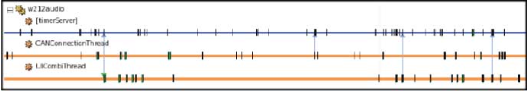
Figure 3. An example of IPC activity between three threads on the Timeline
You can configure the timeline information that's shown in the search result view to show only the interesting trace event fields. The contents of this table can be cut and pasted to the system clipboard as CSV-formatted data.
Using Event labels
The event labels in the Timeline pane show some data and the type for each event. In addition, you can display address translation information such as the function name. Event labels let you quickly distinguish events of different types and display multiple data values for an event, but their main purpose is to annotate function entry and exit events in the Timeline pane with their corresponding function names.
To access the label options, select the Toggle Labels icon in the System Profiler
perspective:
![]()
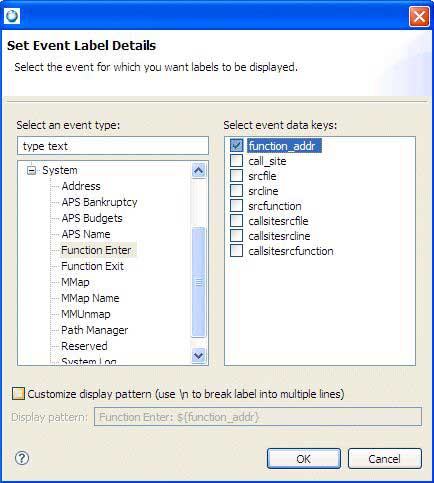
Figure 4. Setting event labels in the System Profiler's Timeline view
- Data keys are specified by using $data_key_name$ and in the Timeline view, they're replaced by the actual value in the event for the given key.
- To allow labels to span multiple lines, use the \n option.
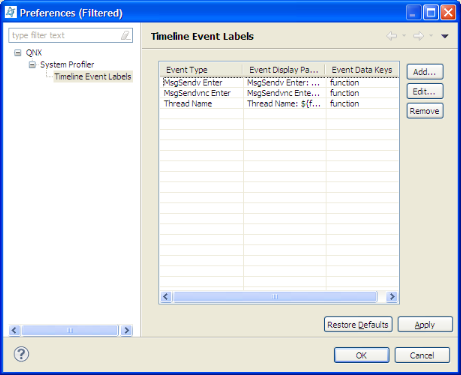
Figure 5. Setting preferences for the System Profiler's Timeline view
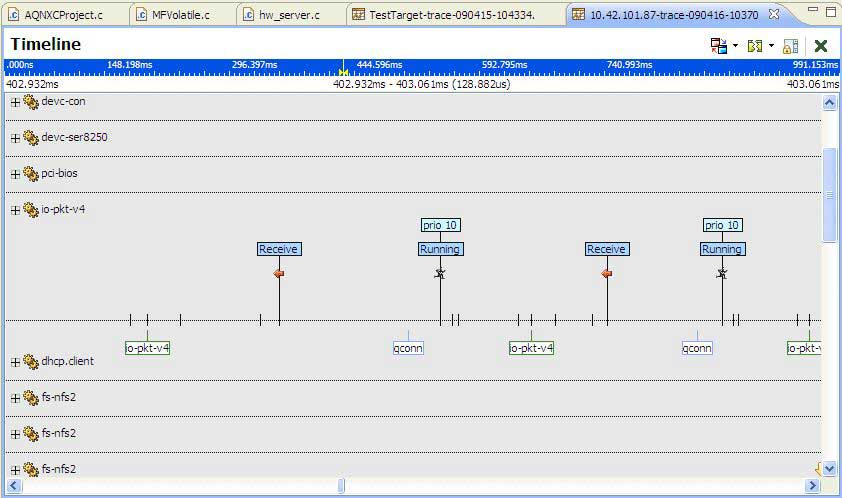
Figure 6. The System Profiler's Timeline view that includes labels
Adding labels to the Timeline
In the Preferences dialog, click Edit to edit any existing labels, or click Add to select an event type for which a label has already been defined. Any changes you make change the previously defined label, for which you'll receive a notification message.
Renaming processes and threads
Renaming processes and threads allows you to identify threads under a different process because they are often not named. Or, if you record using ring mode, because names are lost, you can assign your own names.
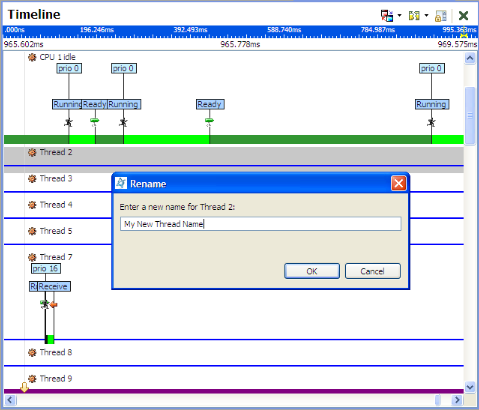
Figure 7. Renaming a process or thread in the Timeline
Navigating to events in a timeline
In the Timeline pane, you can navigate to the next or previous event for a specific owner. This feature lets you follow a sequence of events generated by a particular set of owners (e.g., finding the next event owned by a thread, or the messages generated by a client and server).
In locations where single events have been identified (e.g., the Trace Log or Search Results view), you can navigate directly to the event location in the Timeline pane by double-clicking. The selection marker is moved to the event location and if possible, the specific event owner is scrolled into view in the Timeline pane.
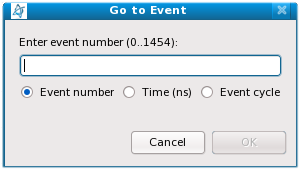
Figure 8. The System Profiler's Go To Event command