This view provides a tabular statistical representation of particular events, and statistics regarding states.
The statistics can be gathered for the entire log file or for a selected range.
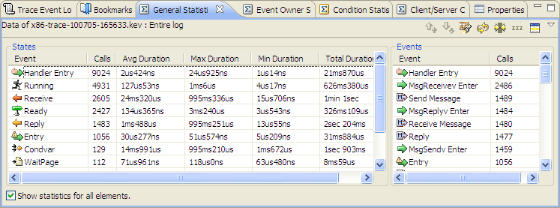
Figure 1. The System Profiler's General Statistics view
Figure 1. The System Profiler's General Statistics view
Note: You'll need to click the Refresh button (
When selected, the Include Idle Threads icon (