The Client/Server CPU Statistics view () tracks the amount of client/server time spent in the RUNNING state. In a message-passing system, it may be that a particular thread is consuming a large amount of CPU time, but that CPU time is being consumed based on requests from one or more clients. In these cases, in order to achieve a higher performance, the client requests on the server must be reduced (assuming that the server is identified as a bottleneck).
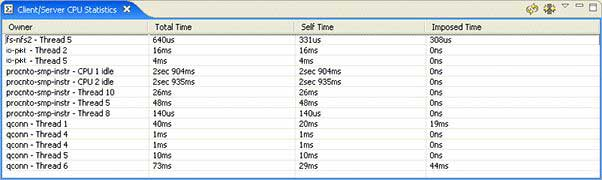
Figure 1. The System Profiler's Client/Server CPU Statistics view
You can expand the table, via the View menu, to show how much time the client imposed on various server threads. The imposed time is cumulative: if client A sends to server B, then until B replies to A, any time that B consumes is seen as imposed on time. If during that time B sends to server C, then server C is also billed time as imposed on by A. The rationale here is that B would not have engaged with server C were it not for the initial message from A.
By sorting by imposed time, it is possible to identify which clients are predominantly driving the system and which servers may be bottleneck points.