The QNX System Information perspective contains views that let you compare the CPU usage of different processes and see how their usage levels are changing.
Comparing CPU usage of processes
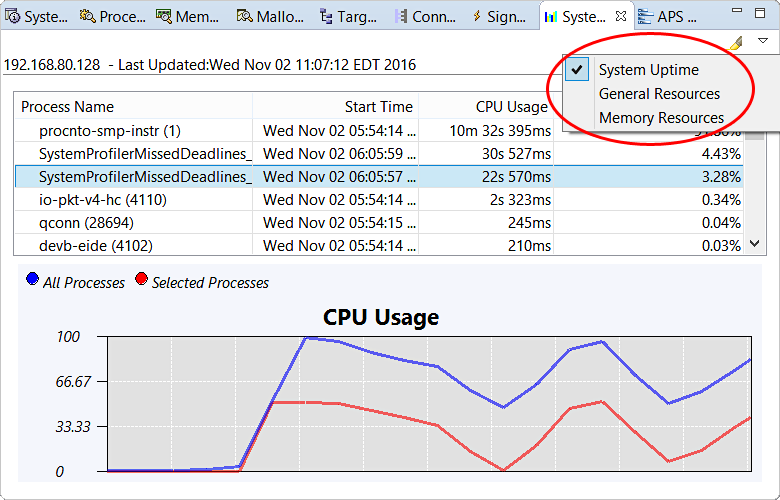
The view then displays a table with the start time, total CPU usage time, and usage as a percentage of system uptime,
for each process. You can sort the table based on any displayed metric, by clicking the corresponding column header.
To easily spot changes in any metric, click the highlight button
(![]() )
in the upper right toolbar. The view then colors in the cells containing any values that changed since the last update.
You can spot a process that's consuming many CPU cycles at the present moment by its steadily increasing Uptime value
(shown in the rightmost column).
)
in the upper right toolbar. The view then colors in the cells containing any values that changed since the last update.
You can spot a process that's consuming many CPU cycles at the present moment by its steadily increasing Uptime value
(shown in the rightmost column).
Below the table, the CPU Usage graph shows the percentage of cycles consumed by various processes over time. By default, the All Processes line is enabled, so the graph illustrates the total CPU usage of all processes. You can also display the cycles used by specific processes, by clicking their names in the table and ensuring that Selected Processes is enabled. In this example, a single process is selected and the graph shows that its CPU usage is affecting the overall system load.
Examining changes in process CPU usage
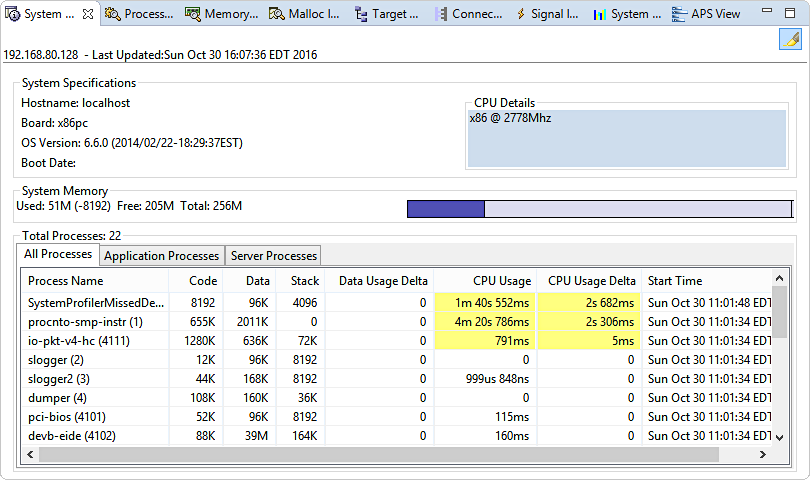
Here, the highlight button has been clicked so that the cells with changed values are colored in, and the process list has been sorted by the CPU Usage Delta column. This metric measures the increase in cumulative CPU time for a process since the last update of the statistics. The default update rate is 5 seconds, so we can see that the SystemProfilerMissedDeadlines process is currently using many CPU cycles because its CPU Usage Delta value is significant compared to that rate.