You can instrument an application binary to report timestamps of function entrances and exits. The Application Profiler can then measure and report the total time spent in each function, allowing you to monitor execution time breakdown based on the application's workflow (i.e., action sequence).
This profiling method has more overhead than sampling execution positions but doesn't require you to gather a statistically significant number of samples, meaning it works on short- or long-running programs. It performs better on one thread because with many threads, the measurement overhead can change the application's behavior.
To profile functions, your source files must be compiled with -finstrument-functions and your binaries linked with -lprofilingS; for details, see “Enabling function instrumentation”.
-
Click the Edit button (
 )
on the right of the Launch Configuration dropdown.
)
on the right of the Launch Configuration dropdown.
-
In the launch bar, click the Profile button
(
 ).
).
The IDE switches to the QNX Analysis perspective. If necessary, the IDE first builds the binary. Then, it uploads the binary and starts running it on the target. At this time, a new session is created and displayed in the Analysis Sessions view. As the application runs, profiling results are sent to the IDE, which stores them in the new session and presents them in the Execution Time view.
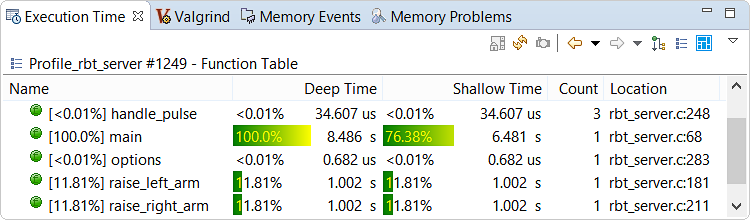
The profiling results include the function runtimes, call counts, and call sites. Initially, function information for all program components is listed. You can expand the Analysis Sessions entry and click a component to filter the display. For example, you may want to see only those runtimes for functions in your program code and not in any libraries that it uses, so you can click the application binary.
You should be able to see statistics for functions in any shared libraries used by your application. If you don't, you must manually define the library paths.
One key point in using function instrumentation is that deep and shallow times have distinct meanings. Deep time is the time spent in a function's own code and in the code of any functions that it calls. Shallow time is the time spent in a function's code and inside any functions that it calls but aren't instrumented themselves. Generally, this is all of the QNX library. Note that shallow time can't be computed for functions still executing. You can change the columns displayed to see nondefault metrics, as explained in the Execution Time reference.
Like the System Information statistics, the profiling results are refreshed every five seconds (by default), so you can closely monitor changes in execution time breakdown as you interact with the application. Double-clicking on any listing with a file and line number shown in the Location column opens the source code at that location. The IDE displays a bar graph and the execution time in the left margin.