The Timeline panel can be used to gather information that helps you analyze browser activity and webpage loading times.
You can use the Timeline panel to analyze the time it takes to complete the different activities that the browser engine must perform to completely load and render your webpage. You can also contrain the view of the timeline and also filter events to better analyze your app's performance.
The Timeline panel
Initially, the panel displays no information, so you must click the Record button in the status bar to allow Web Inspector to record the browser engine activity.
As it records browser engine activity, the Record button turns red and Web Inspector adds data to the Timeline panel.
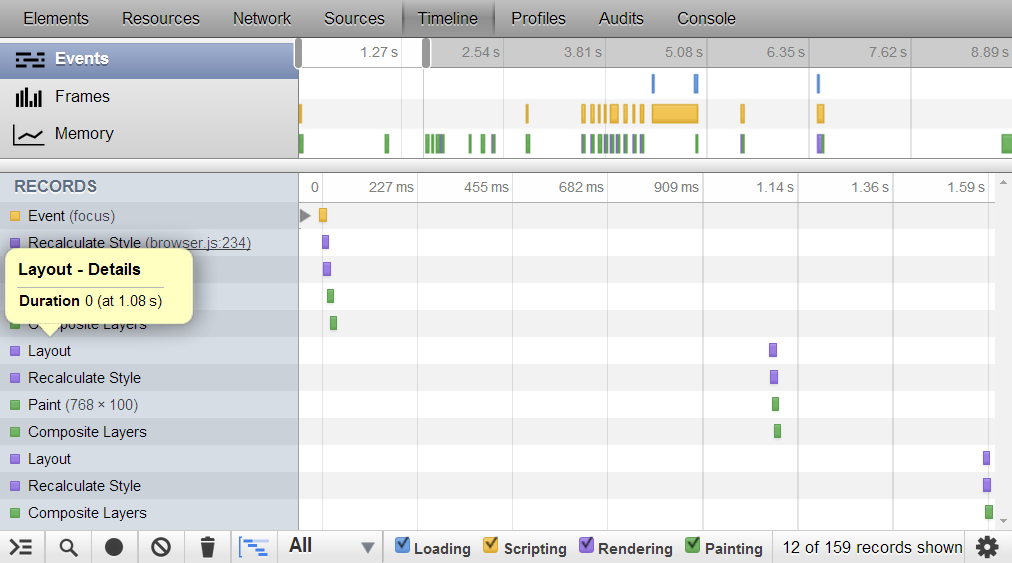 Figure 1. The Web Inspector Timeline panel
Note that all browser engine activity pauses when the device is locked or the browser or HTML5 application is minimized. In order for Web Inspector to record any activity, the browser or HTML5 application must be the active application and the device or simulator screen mustn't be locked.
The Timeline panel is divided into two panes:
- In the top pane, the Timeline panel allows you to select
which timeline view you want to show. You can choose three views:
- Events: Shows the time it takes for the browser engine to complete each of the events required to completely load the content.
- Frames: Shows the browser engine activity for each screen refresh.
- Memory: Shows memory consumption over time.
- In the lower pane, the Timeline panel shows a waterfall timeline for the timespan that was selected in the top pane. The data in the timeline is determined by the mode you select in the top pane of the timeline's panel.
Constrain view to a specific time span
- Click the Timeline icon on the toolbar to display the Timeline panel.
- If necessary, record the browser engine activity to generate timeline data.
- In the top pane of the Timeline panel, click and drag a gray slider handle to increase or decrease the time span.
 Figure 2. Changing the timespan on the Timeline panel
Filter the timeline events
- If necessary, record the browser engine activity to generate timeline data.
- In the status bar at the bottom of the Timeline panel, deselect the event types you want to remove from the timeline.