The Sources panel allows you to debug the JavaScript code used by your webpage.
Web Inspector lets you set breakpoints and step through your code, which can help to locate and correct problems in your code. When you determine that the script is functioning as intended, you can copy the changes back into the source file.
To use the Sources panel, you must first enable debugging. When you first view the Sources panel, Web Inspector prompts you to enable debugging for just the current session or for all sessions.
The Sources panel
You can click the Sources icon in the toolbar to display the Sources panel.
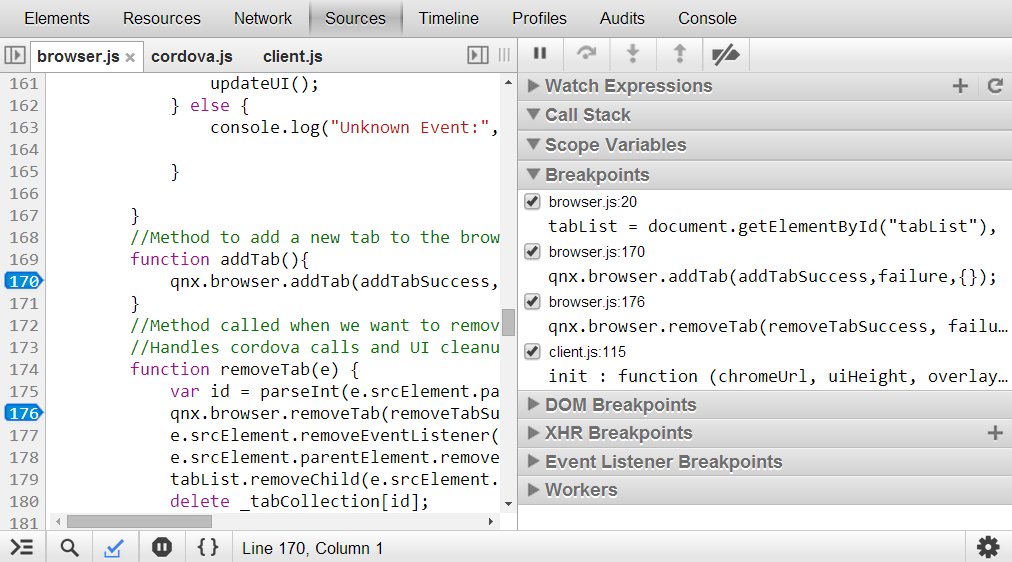 Figure 1. The Web Inspector Sources panel
The Sources panel is divided into two sections. On the left is the document pane, which allows you to view and debug JavaScript. On the right is a set of collapsible panes that display information related to the displayed script.
A toolbar at the top of the Sources panel allows you to choose the script file you want to inspect and to cycle between open scripts. It also provides a set of controls that allow you to step through the script displayed in the document pane.