This view displays details for the events surrounding the event selected in the Timeline pane.
With this view, you can see every kernel event that occurred during the trace period and the exact ordering of the events.
Given the large number of events (even in relatively short traces), you may want to show only certain events, to find
areas of interest. You can click the Enable/disable event filtering button
(![]() ) in the view's toolbar to toggle
between showing all events or only those that match the filters defined in the Filters view.
Or, you can show all events and highlight the ones that match, by clicking the highlight button
(
) in the view's toolbar to toggle
between showing all events or only those that match the filters defined in the Filters view.
Or, you can show all events and highlight the ones that match, by clicking the highlight button
(
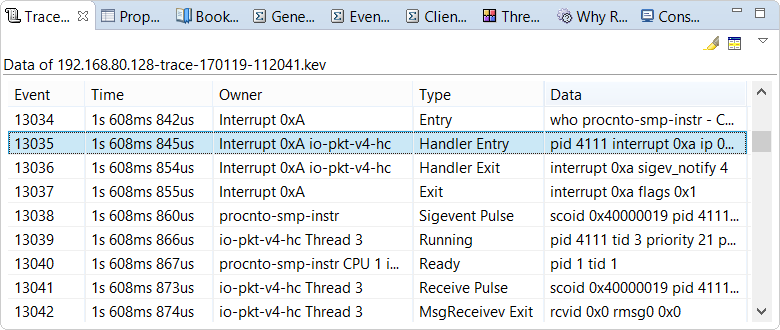
- Event — A unique number indicating the event's relative occurrence within the trace period.
- Time — The event's timestamp, relative to the trace start.
- Owner — The event owner, which can be a process, thread, interrupt vector, or interrupt handler.
- Type — The event type.
- Data — Data associated with the event. Often, the PID and TID are included; for message-related events, the message ID is included.
You can display additional columns or change the order of the columns.
The view's dropdown menu (![]() )
contains one option, Configure Trace Event Table, which opens a popup window
in which you can configure the table display.
)
contains one option, Configure Trace Event Table, which opens a popup window
in which you can configure the table display.
As you navigate events in the timelines by using the System Profiler toolbar buttons, the selection in Full Trace Event Log gets updated and the view scrolls to the new locations.