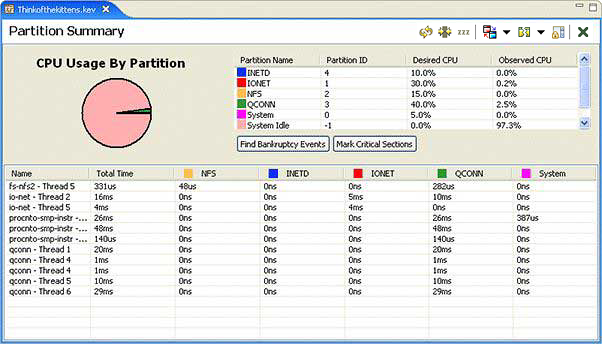
In the System Profiler editor, the Partition Summary pane provides a log file summary that's focused on QNX's adaptive partitioning technology. For each distinct configuration of partitions detected in the log file, the distribution of CPU usage over those partitions is displayed, along with a table showing the CPU usage for each event owner in each partition.
You can switch to this pane through the menu item , or by selecting this pane in the editor's dropdown menu for switching
panes (![]() ).
).
You can use this pane along with the CPU Usage pane to examine areas of interest in the
log file data. Note that the Partition Summary pane contains valid data only when the
log file contains partition information and the process and thread states are logged in
wide mode (so the partition thread scheduling data is collected).
The summary information displayed in this pane is based on the time range selected in the
Timeline pane.
By default, the partition information for the entire log period is shown, but you can
click the toggle button (![]() ) in the pane's toolbar to show only the data in the specified
range.
) in the pane's toolbar to show only the data in the specified
range.