This view lets you trace server time back to individual clients, by showing, for each thread, the time that it spent performing work for itself (self time) or that another thread spent performing work for it (imposed time).
In a message-passing system such as QNX Neutrino, sometimes a particular thread consumes a lot of CPU time but that time is primarily spent servicing client requests. In this case, the total CPU usage for that server thread doesn't tell the whole story because you need to know which clients are imposing the heaviest load so you can optimize them. To identify clients and servers, the System Profiler uses the message-passing events in the kernel event trace log. For an explanation of self time versus imposed time in relation to such events, see "Isolate client CPU load from server CPU load".
- No trace data are displayed until you click the Refresh statistics button
(
 );
some views have a different name for this button but it does the same thing.
Note: If you're viewing statistics from one kernel event log file but then open another log file, the results in the statistics-related views won't reflect the newly opened file until you refresh them manually.
);
some views have a different name for this button but it does the same thing.
Note: If you're viewing statistics from one kernel event log file but then open another log file, the results in the statistics-related views won't reflect the newly opened file until you refresh them manually. - They can display statistics that reflect either the entire trace period or the timeframe selected in an editor pane.
The display mode is controlled by the Toggle global/selection statistics gathering button
(
 ) as well as the top option in
the upper right dropdown (
) as well as the top option in
the upper right dropdown ( ).
). - They can generate a CSV report of the data currently displayed. This feature is accessed through the bottom option in the upper right dropdown.
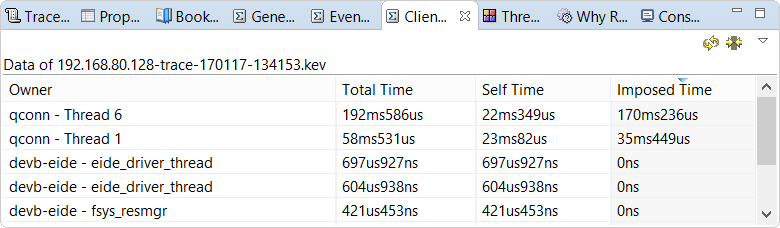
- Owner — process name, followed by thread name
- Total Time — total of self and imposed times
- Self Time — overall CPU time the thread spent executing code for itself
- Imposed Time — overall CPU time that other threads spent executing code on behalf of the thread (in response to requests it issued by message sends); this accounts for all server threads
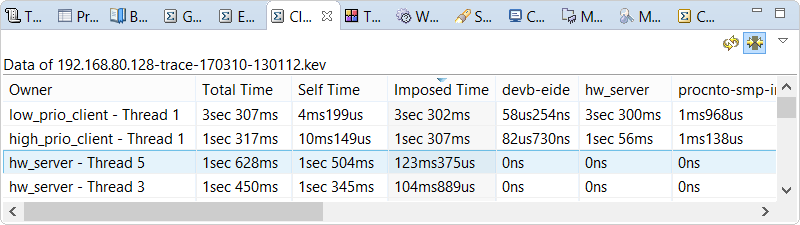
You can expand the table to show how much CPU time each client imposed on individual servers. To do so, click
Show all times in the upper right dropdown. The table then displays columns containing server names
and listing the times imposed by each client. This makes the table quite wide, so you'll likely have to scroll right to
find the metrics of interest.
Note that imposed time is cumulative: if client A sends to server B, then until B replies to A, any CPU time that B consumes is seen as imposed time for A. If during that time B sends to server C, then server C's CPU time is also billed as imposed time for A. The rationale here is that B would not have engaged with C if A hadn't sent the initial message to B.
To sort the table by a metric, click its column header once for descending order or twice for ascending order. Sorting the threads by Imposed Time lets you quickly identify which clients are predominantly driving the system and which servers may be bottlenecks.