The Profiler Sessions view displays all profiling sessions created in the current workspace. From this view, you can control what profiling data is displayed, when data is gathered from an active session, and compare results from different sessions.
When a new profiling session is created, either when you launch an application built for profiling from the
IDE or import existing profiling results, it's listed at the bottom of the view.
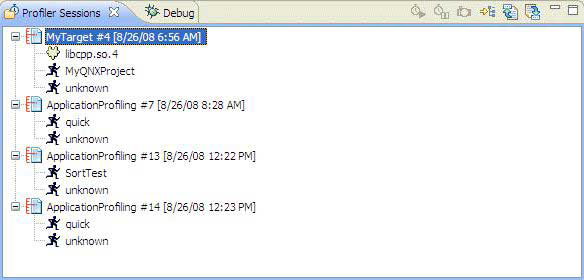
The oldest session (i.e., the one that ran earliest) is listed at the top.
Each session header consists of the name of the launch configuration, the binary name, a session number, and a timestamp.
The session number gets incremented each time a program is run with the Application Profiler or results are imported.
When you click one or more open sessions, which are indicated with the open session icon
(![]() ), the other views in the
perspective are updated to show the data for those selected sessions. The function runtimes and call counts are
aggregate measurements when you select multiple sessions.
), the other views in the
perspective are updated to show the data for those selected sessions. The function runtimes and call counts are
aggregate measurements when you select multiple sessions.
Closed sessions, which are indicated with another icon (![]() ), must be opened for you to see their data. You can do this by double-clicking a closed session
or right-clicking it and choosing Open.
), must be opened for you to see their data. You can do this by double-clicking a closed session
or right-clicking it and choosing Open.
| Type | Icon |
|---|---|
| Running binary |
|
| Shared libraries |
|
| DLLs |
|
| Unknown |
|
An Unknown item refers to code that doesn't belong to any binary or library. Usually, this is kernel code mapped to process virtual memory.
For Sampling and Call Count profiling, the tree view includes only those binaries and libraries that were built with call count instrumentation and that have position samples taken during execution. If the application runs for a short period of time (say, less than ten seconds), a library might not have even a single sample.
For Functions Instrumentation profiling, only those binaries and libraries built with functions instrumentation appear in the tree view. System libraries, such as libc, don't appear.