Note:
If your binary is instrumented with Mudflap, you can't run Memory Analysis on it because there
will be a conflict trying to overload the same functions, which will make the program crash.
To enable memory error detection from the IDE:
-
Using the first four checkboxes under Enable error detection, specify the types of problems
you want to look for.
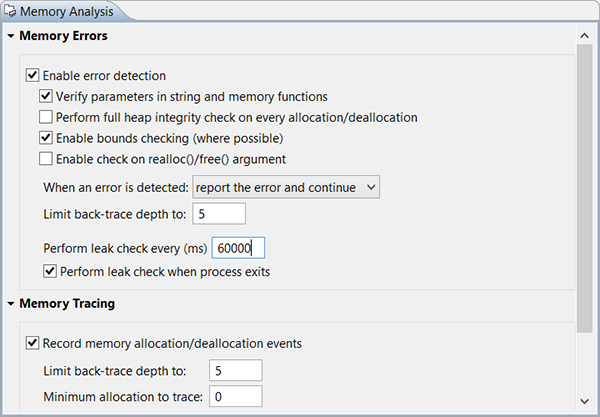
For information about these error check controls and the other UI fields that control what data appears in the analysis results, see Configuring Memory Analysis sessions.
As your application runs, the Memory Events and Memory Problems views display the analysis results. For details on using these views, see Interpreting Memory Analysis results.
You can also adjust the Memory Analysis settings for the running application through the Settings tab of the editor.