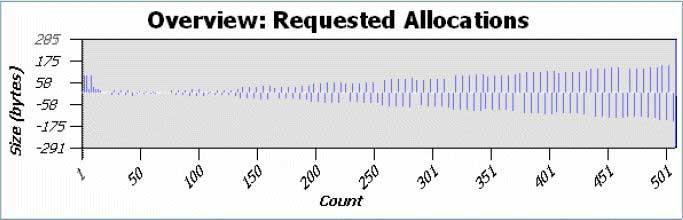
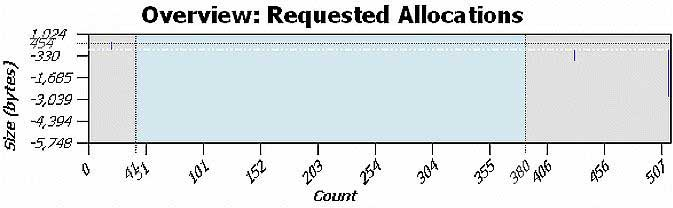
After you have prepared a memory analysis (profiling) session, double-click on a session to open the Memory Analysis Session viewer. The Allocations page shows the Overview: Requested Allocations chart. For example, let's take a closer look at this chart.
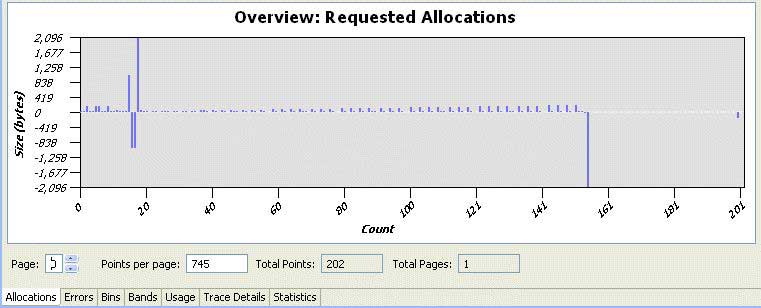
This example chart shows memory allocation and deallocation events that are generated by the malloc and free functions and their derivatives. The X-axis represents the event number (which can change to a timestamp), and the Y-axis represents the size (in bytes) of the allocation (if a positive value), or the deallocation (if a negative value).
Let's take a closer look at the bottom portion of the chart. The Page field shows the scrollable page number, the Total Points field shows how many recorded events there are, the Points per page field shows how many events can fit onto this page, and the Total Pages field shows how many chart pages there are in total.
For this example, there are 202 events that fit within the chart; however for some larger charts, all of them would not likely fit on this single chart. If that were the case, there are several choices available. First, you can attempt to reduce the value in the Points per page field to 50, for example.
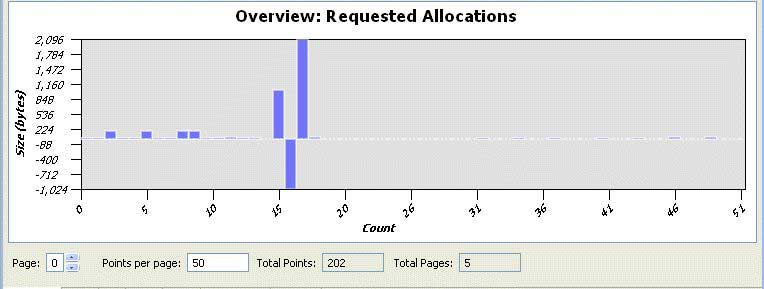
However, in the case where the number of events is large (the X-axis value is a large number, 1482 events), changing the value of Points per page field might not significantly improve the visual appearance of the data in the chart. For this example, there are 1482 events, and all of these events don't fit on a single chart:
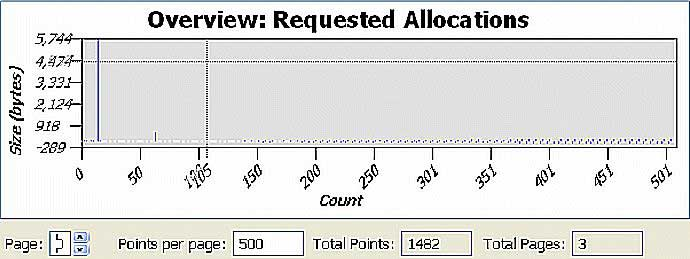
If you reduce the value in the Points per page field to 500, the graphical representation will be better; however, it's still not very useful.
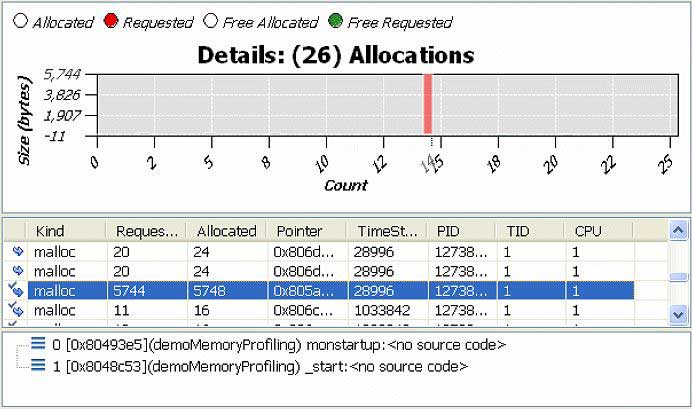
Alternatively, you can use filters to exclude data from the chart. If you look at the Y-axis of the following chart, notice some large allocations at the beginning. To see this area more closely, select this region with the mouse. The chart and table at the top change to populate with the data from the selected region.
Now, locate the large allocation and check its stack trace. Notice that this allocation belongs to the function called monstartup, which isn't part of the user defined code; meaning that it can't be optimized, and it can probably be excluded from the events of interest.
You can use a filter to exclude this function. Right-click on the Overview chart's canvas area and select Filters... from the menu. Type 1-1000 in the Requested Size Range field. The overview will look like this:
From the filtered view, there is a pattern: the allocation is followed by a deallocation, and the size of the allocations grows over time. Typically, this growth is the result of the realloc pattern. To confirm the speculation, return to the Filters... menu option, and disable (un-check) all of the allocation functions, except for the realloc-alloc option. Notice that the growth occurs with a very small increment.
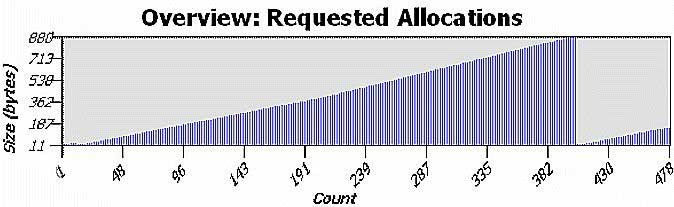
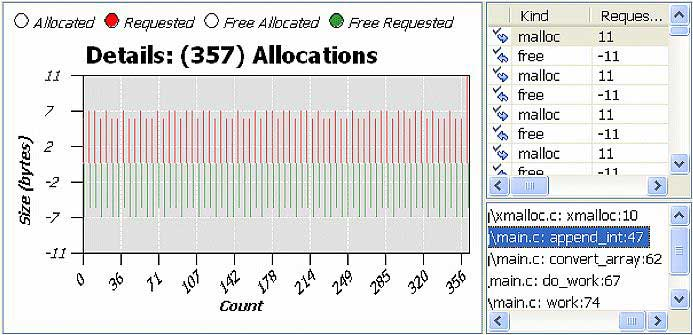
Next, select a region of the Overview chart and explore the event table. Notice the events with the same stack trace; this is an example of a realloc call with a bad (too small) increment (the pattern for a shortsighted realloc).
Notice that the string in the example was re-allocated approximately 400 times (from 11 bytes to 889 bytes). Based on that information, you can optimize this particular call (for performance) by either adding some constant overhead to each realloc call, or by double allocating the size. In this particular example, if you double allocate the size, re-compile and re-run the application, and then open the editor and filter all but the realloc events, you'll obtain the following:
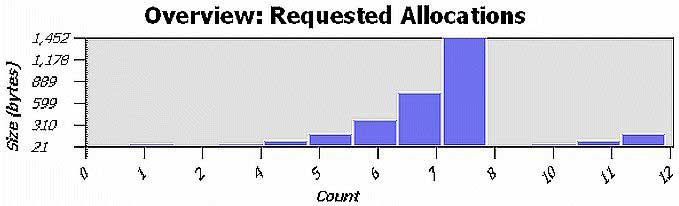
The figure above shows only 12 realloc events instead of the original 400. This would significantly improve the performance; however, the maximum allocated size is 1452 bytes (600 bytes in excess of what is required). You can adjust the realloc code to better tune it for a typical application run. Normally, you should make realloc sizes similar to the allocator block sizes.
To check other events, in the Filters menu, enable all functions, except for realloc. Select a region in the overview:
In the Details chart, the alloc/free events have the same size. This is the typical pattern for a short-lived object.
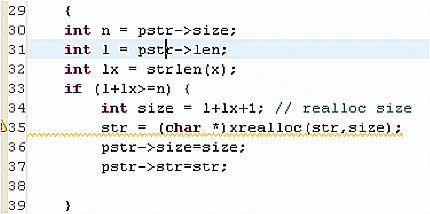
To navigate to the source code from the stack trace view, double-click on a row for the stack trace.
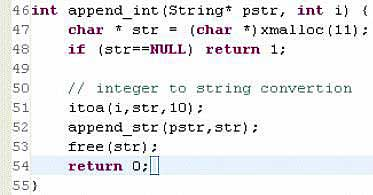
This code has an object that allocates 11 bytes, and then it is freed at the end of the function. This is a good candidate to put a value on the stack. However, if the object has a variable size, and originates from the user, using stack buffers should be done carefully. As a compromise between performance and security, you can perform a size verification, and if the length of the object is less than the buffer size, it is safe to use the stack buffer; otherwise, if it is more than the buffer size, the heap can be allocated. The buffer size can be chosen based on the average size of allocated objects for this particular stack trace.
Shortsighted realloc functions and short-lived objects are memory allocation patterns which can improve performance of the application, but not the memory usage.