If your application uses shared libraries, you most likely want to see their symbols in the Memory Analysis data.
To see file names and line numbers in the backtrace, shared libraries must be compiled with debug information and not
stripped on the host. Also, they must match the library versions on the target (except the debug symbols section).
Otherwise, the backtrace will show random locations. If a shared library isn't found on the host, its backtrace
will contain only binary addresses.
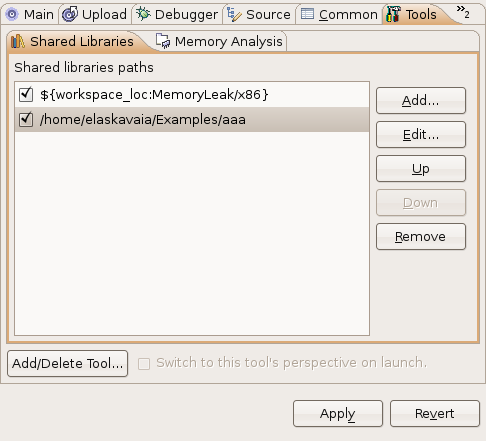
To see symbol information for shared libraries, you must add the Shared Libraries tab
and the shared libraries search path in your launch configuration:
-
In the Shared Libraries tab, click Add… to
open a popup window from which you can specify a host path for the shared libraries.
In the Session View, you can expand your session, expand your process, and then select a shared object to view its memory events
and traces in an editor or views.