In the QNX Code Coverage perspective, the Code Coverage Sessions view shows the coverage data for individual runs of projects (i.e., sessions).
After launching a coverage-enabled project, you can switch to this perspective if necessary by clicking its icon
(![]() ) in the toolbar at the top.
The Code Coverage Sessions view, which is shown in the upper left corner by default, lets you interact with any newly launched
(and active) sessions as well as any that have finished. To show the coverage data for a session, simply click its header in
the view. The IDE computes the coverage percentages and displays them for the session items:
) in the toolbar at the top.
The Code Coverage Sessions view, which is shown in the upper left corner by default, lets you interact with any newly launched
(and active) sessions as well as any that have finished. To show the coverage data for a session, simply click its header in
the view. The IDE computes the coverage percentages and displays them for the session items:
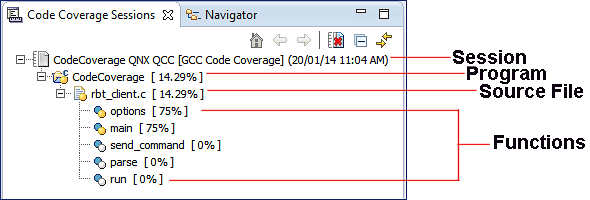
| Item | Description | Icons |
|---|---|---|
| Session | Launch configuration name, coverage tool, and start time (e.g., ccov102_factor [GCC Code Coverage] (7/2/03 2:48 PM)) |
|
| Project | Project name and amount of coverage (e.g., ccov102_factor [ 86.67% ]) |
|
| File | Filename and amount of coverage (e.g., ccov102_factor.c [ 86.67% ]) |
|
| Function | Function name and amount of coverage (e.g., main [ 100% ]) |
|
| Icon | Color | Meaning |
|---|---|---|
|
|
White | No coverage |
|
|
Yellow | Partial coverage |
|
|
Green | Full (100%) coverage |
|
|
(cell is highlighted) | Out-of-date source file |
|
|
Red | Code not executed, or a marker indicating some error (e.g., a code coverage data file wasn't found or couldn't be read). |
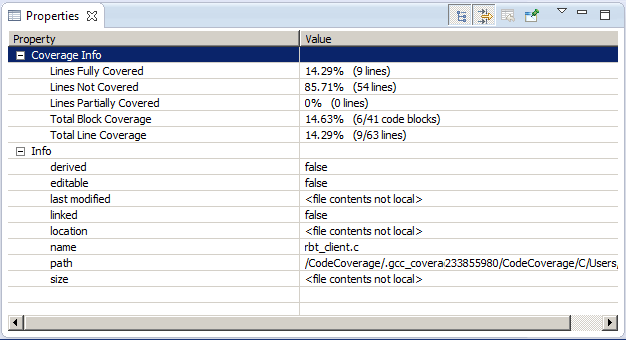
Code coverage summary in Properties view
The Properties view, which is displayed in the lower left corner by default, shows a summary of the code coverage for the
session, project, file, or function selected in the Code Coverage Sessions view. The summary tells you how many lines were
fully covered, not covered, partially covered, and more:
Viewing coverage for source code
- Expand a session and double-click a file or function.
Showing coverage data when opening a file
- Select to open the Preferences dialog.
- In the left pane, select .
- In the right pane, check the desired markers in the Coverage markup when file is opened field.
- Click OK.
The next time you open a file, the coverage markers appear automatically.
Removing coverage markers
- In the Code Coverage Sessions view's title bar, click the Remove All Coverage Markers button (