You can use the Timeline panel to analyze the time it takes to complete the different activities that the browser engine must perform to completely load and render your webpage.
The Timeline panel
Initially, the panel displays no information, so you must click the Record button in the status bar to allow Web Inspector to record the browser engine activity.
As it records browser engine activity, Web Inspector adds data to the Timeline panel.
Note that all browser engine activity pauses when the device is locked or the browser or HTML5 application are minimized. In order for Web Inspector to record any activity, the browser or HTML5 application must be the active application and the device or simulator screen mustn't be locked.
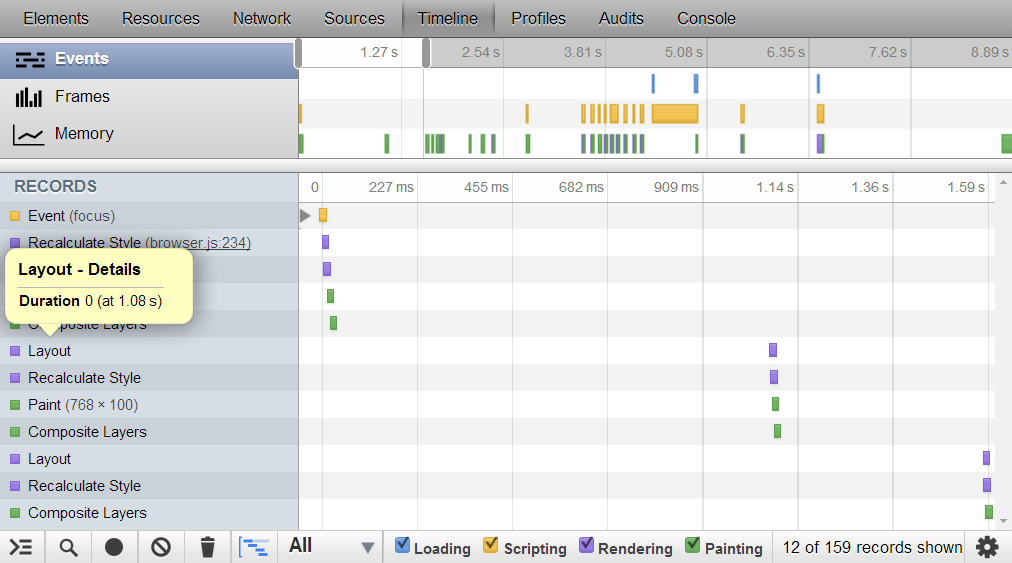
The Timeline panel is divided into two panes:
- In the top pane, the Timeline panel allows you select which
timeline view you want to display. You can choose three views:
- Events: Shows the time it takes for the browser engine to complete each of the events required to completely load the content.
- Frames: Shows the browser engine activity for each screen refresh.
- Memory: Shows memory consumption over time.
- In the lower pane, the Timeline panel shows a waterfall timeline for the timespan that was selected in the top pane. The data in the timeline is determined by the mode you select in the top pane of the timeline's panel.