Profile the performance of your CSS selectors
-
On the Profiles panel, select Collect CSS
Selector Profile.
-
To start profiling your memory usage, click Start. The
button turns red as Web Inspector records the memory usage.
-
To stop recording, click Stop. When you stop recording,
the new profile is added under the CSS Selector Profiles
section in the left pane and the profile's contents are displayed in the right
pane:
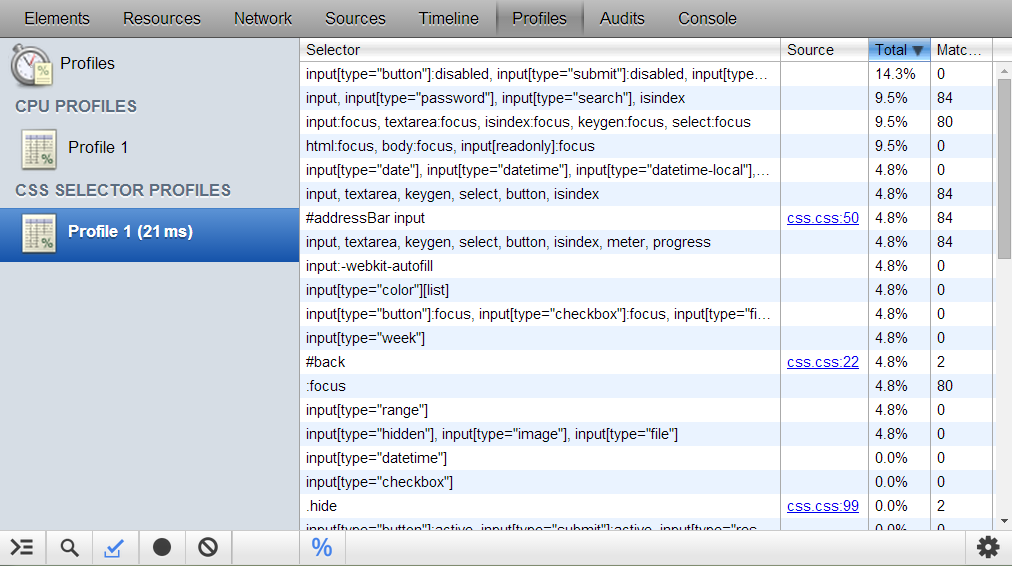
The profile results
indicate the amount of time the browser engine spent matching each selector in
the associated style sheets, along with the total number of times the browser
engine found a match for the selector.
-
To specify whether the value of the Total column is
presented as a time value or as a percentage of the total time required to
process the CSS, toggle the percent button on or off.