To profile memory usage:
- Click the Profiles icon on the toolbar to display the Profiles panel.
- On the Profiles panel, select Collect JavaScript CPU Profile.
- To start profiling your memory usage, click Start. The button turns red as the Web Inspector is recording the memory usage.
-
To stop recording, click Stop. When you stop recording, the new profile is
added under the CPU Profiles section in the left pane and the profile's contents
are displayed in the right pane:
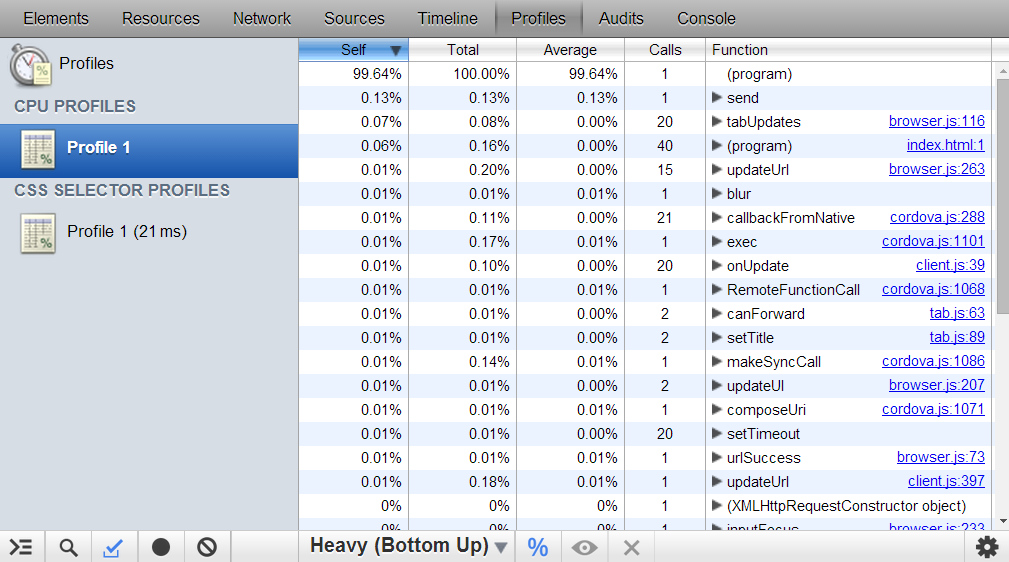
The results indicate the amount of time the browser engine spent executing each function during the recording process, along with the number of times each function was called. An excessive amount of time spent in any one function can indicate a problem with the code. -
To sort the data, perform any of the following actions:
- To sort by values in any column, double-click the column heading.
- To display calls based on greatest impact on all exceptions or where they occurred in the call stack, in the status bar at the bottom of the panel, toggle between Heavy (Bottom Up) and Tree (Top Down).
- To specify whether values are presented as a time value or as a percentage of the total CPU usage required to process all the functions, toggle the percent button on or off.
- To view a single function, select the call in the table and then click the focus button.
- To exclude a single function from the data, select the function in the table and then click the exclude button.
- To reload the original profile after focusing on or excluding a function, click the reload button.