The System Profiler editor is the center of all analysis activity. It provides different ways of visualizing the event data in the log files.
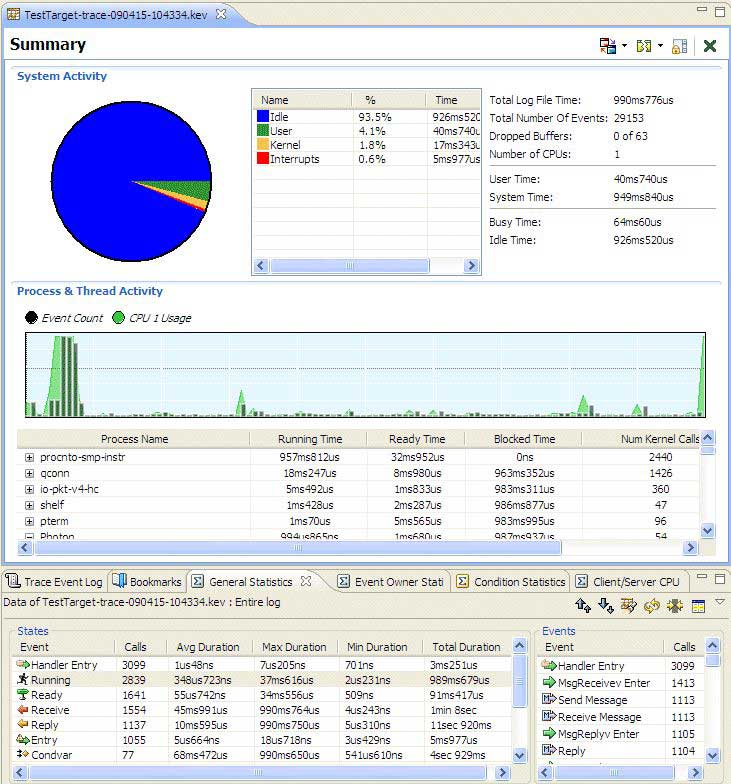 Figure 1. The System Profiler editor.
The System Profiler editor panes include the following:
- Summary pane (the default)
- Shows a summary of the activity in the system, accounting for how much time is spent
processing interrupts, running system-level or kernel-level code, running user code, or
being idle.
The IDE generates an overview of the CPU and trace event activity over the period of the log file. This overview contains the same information displayed in the System Profiler Overview view.
The process activity (amount of time spent RUNNING or READY, number of kernel calls) displayed in the Summary pane contains the same information as can be extracted by drilling down for a particular time range of the event log using the General Statistics view.
The System Activity area of the Summary pane shows the following:
- Idle — the time that the idle thread (or threads) was (were) executing.
- User — the time spent in threads in processes.
- System — the time spent in the kernel.
- Interrupts — the time spent handling interrupts. Typically, this value is low; however, a high value might indicate faulty hardware, a bad driver, or profiling for too many applications.
- System Time — the sum of Idle, System, and Interrupts from the pie chart.
The Process and Thread Activity area of the Summary pane shows the following:
- a change in CPU usage and event rate.
- metrics on how busy each individual process/thread was.
- CPU Activity pane
- Shows the CPU activity associated with a particular thread or process. For a thread, CPU activity is defined as the amount of runtime for that thread. For a process, CPU activity is the amount of runtime for all of the process's threads combined.
- CPU Migration pane
- Show the potential performance problems that are associated with multiple-CPU systems.
- CPU Usage pane
- Show the percent of CPU usage associated with all event owners. CPU usage is the amount of runtime that event owners get. CPU usage can also be displayed as a time instead of a percentage.
- Inter CPU Communication pane
- Show CPU communication analysis for multi-core systems.
- Partition Summary pane
- Show adaptive partition usage and summary information.
- Timeline pane
- Graphically show events associated with their particular owners (i.e. processes, threads, and interrupts) along with the state of those particular owners (where it makes sense to do so).
To choose one of the other types, right-click in the editor, then select , or click this icon:
You can choose a specific display type from the dropdown menu associated with this menu item or icon.
For the CPU Activity pane is not customizable. The CPU Usage pane is configurable (the graph types are line and area) by selecting .
3D versions of some charts, such as CPU activity, are also available.
Each of these visualizations is available as a pane in a stack of panes. Additionally, the visualization panes can be split — you can look at the different sections of the same log file and do comparative analysis.
All panes of the same stack share the same display information. A new pane inherits the display information from the previous pane, but becomes independent after it's created.
To split the display, right-click in the editor, then select , or click this icon:
You can lock two panes to each other. From the Split Display submenu,
choose the graph you want to display in the new pane, or click this icon:
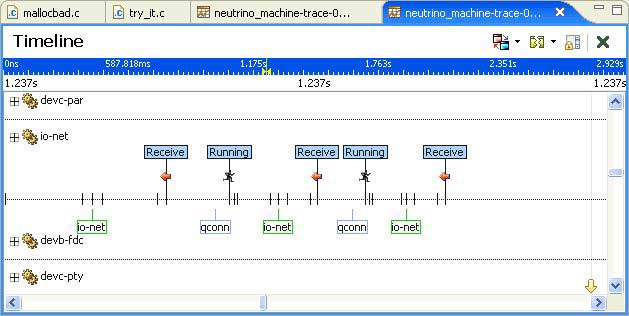
For the Timeline pane, a number of different features are available from within the editor:
- Event owner selection
- If you click on event owners, they're selected in the editor. These selected event
owners can then be used by other components of the IDE (such
as Find).
If an owner has children (e.g. a parent process with threads), you'll see a plus sign beside the parent's name. To see a parent's children, click the plus sign.
Click the Next event by owner icon (
 ) to skip over events to focus on a single owner, which allows to you easily
navigate through events of the same owner in the timeline.
) to skip over events to focus on a single owner, which allows to you easily
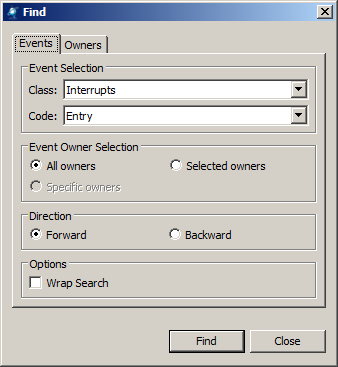
navigate through events of the same owner in the timeline. - Find
- Pressing Ctrl
F (or selecting ) opens a dialog that lets you quickly move from event to event. This is
particularly useful when following the flow of activity for a particular event owner or
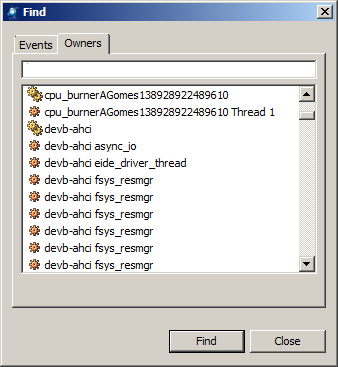
when looking for particular events. Additionally, you can also use the Owners tab to help
you sort through many different processes.
On the Events tab, the Class and Code fields are populated with values from the currently selected event in the Timeline view.
Click the Owners tab and select from the list of available owners from the current trace to find an owner on the timeline that isn't visible.
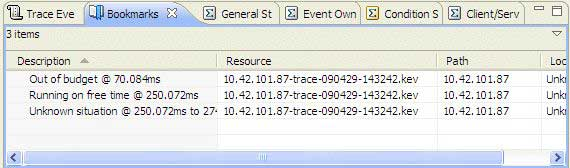
- Bookmarks
- You can place bookmarks in the timeline editor just as you would to annotate text files.
To add a bookmark, click the Bookmark icon in the toolbar (
 ), or right-click in the editor and choose Bookmark from
the menu.
), or right-click in the editor and choose Bookmark from
the menu.
These bookmarks show up in the Bookmarks view and can represent a range of time or a single particular event instance.
- Cursor tracking
- The information from the System Profiler editor is also made available to other components in the IDE such as the Trace Event Log view and the General Statistics view. These views can synchronize with the cursor, event owner selections, and time ranges, and can adjusts their content accordingly.
- IPC representation
- The flow of interprocess communication (e.g. messages, pulses) is represented by a
vertical arrow between the two elements.
You can toggle IPC tracing on/off by clicking this button in the toolbar:

By default, this displays the IPC trace arrows for all event owners. You can choose to display only the arrows for the selected owners by choosing Selection from the button's dropdown menu.
- Display Event Labels
- The Display Event Labels button in the toolbar (
) lets you display labels in the timeline; open the button's dropdown menu and select the type of labels you want to display:
- Priority Labels — display the thread's priority
- State Labels — display the thread's state as a label
- State Icons — display the thread's state as an icon above the thread
- IPC Labels — add text boxes to the IPC lines to indicate which thread or process you're communicating with
- Event Labels — display labels for kernel events, including I/O and memory events
If you haven't expanded a process in the display, the labels for all of its threads are displayed. By default, no labels are displayed.
Types of selection
For the Timeline pane, within the editor you can select either of the following:
- an owner (e.g. a process or thread)
- a point in time
Owners
To select a single owner, simply click the owner's name. To unselect an owner, press and hold the Ctrl key, then click each selected owner's name.
To select multiple owners, press and hold the Ctrl key, then click each owner's name.
Time
To select a point in time, click an event on the timeline.
To select a range, click the start point on the timeline, then drag and release at the end point.
Or, select the start point, then hold down the Shift key and select the end point.
Scrolling
You can use these keys to scroll through time:
| To move: | Use this key: |
|---|---|
| The selection to the left by one event | Ctrl ← |
| The selection to the right by one event | Ctrl → |
| The display to the left | ← |
| The display to the right | → |
| The selection for the current owner to the left by one event | Ctrl Shift ← |
| The selection for the current owner to the right by one event | Ctrl Shift → |
You can use these keys to scroll through the owners:
| To move the display: | Use this key: |
|---|---|
| Up by one owner | ↑ |
| Down by one owner | ↓ |
| Up by one page (horizontal scrollbar thumb size) | Page Up |
| Down by one page (horizontal scrollbar thumb size) | Page Down |
| To the top of the owner list | Home |
| To the bottom of the owner list | End |
Hovering
When you pause your mouse pointer over an owner or an event, you'll see relevant information (e.g. PID, timestamps, etc.).