Regardless of how your log file is captured, you have a number of different options for regulating the amount of information actually captured:
- On/Off toggling of tracing
- Static per-class Off/Fast/Wide mode filters
- Static per-event Off/Fast/Wide mode filters
- User event-handler filters
(For more information, see the SAT User's Guide.)
The IDE lets you access the first three of the above filters. You can enable tracing (currently done by activating the Log Configuration dialog), and then select what kind of data is logged for various events in the system.
The events in the system are organized into different classes (kernel calls, communication, thread states, interrupts, etc.). You can toggle each of these classes in order to indicate whether or not you want to generate such events for logging.
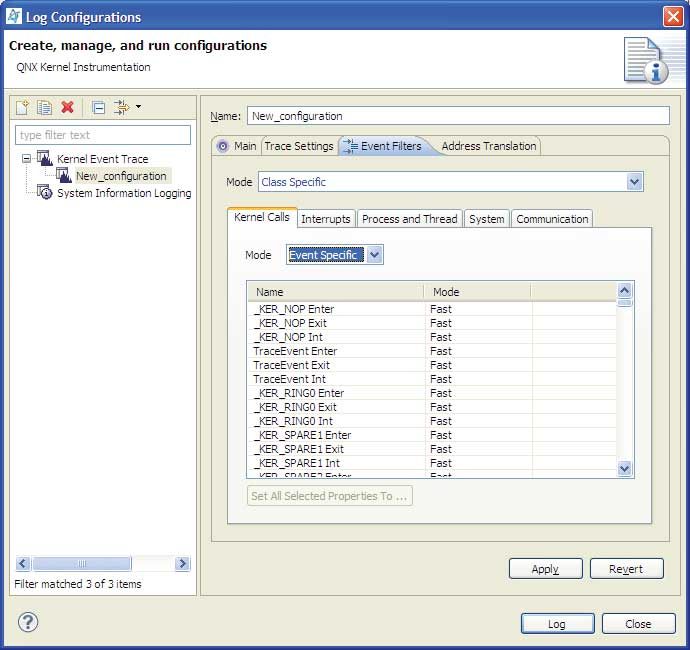
- Disable
- This mode lets you select disable (no data is collected), Fast, Wide, or Event Specific.
- Fast mode
- A small-payload data packet that conveys only the most important aspects of the particular event. Better for performance.
- Wide mode
- A larger-payload data packet that contains a more complete event definition, with more context. Better for understanding the data.
- Event Specific
- This mode lets you select specify what data to collect for each of the
following event classes:
- Interrupts
- Process and Thread
- System
- Communication
Depending on the purpose of the trace, you'll want to selectively enable different tracing modes for different types of events so as to minimize the impact on the overall system. For its part in the analysis of these events, the IDE does its best to work with whatever data is present. (But note that some functionality may not be available for post-capture analysis if it isn't present in the raw event log.
By default, the IDE logs all events in Fast mode, except for Thread Running events, which it logs in Wide mode.
Click Set All Selected Properties to set all currently selected events to a single mode type.
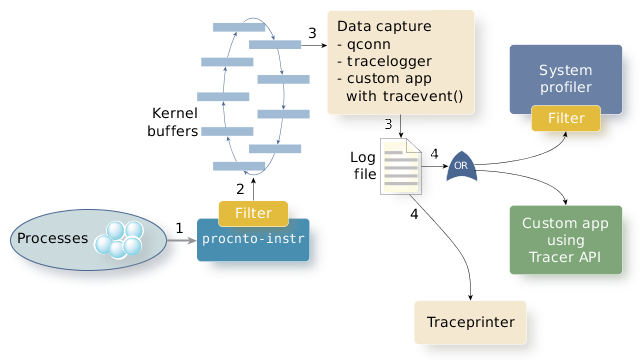
The following illustration shows how this type of filtering affects the logging process
for procnto-instr: