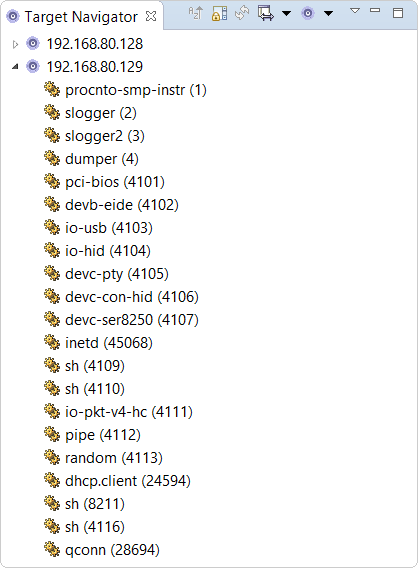
The Target Navigator view lists the targets and, for the connected ones, the processes running on them. Through this view's controls, you can configure kernel event tracing and adaptive partitioning for targets and send signals to processes, attach the debugger to them, and adjust their scheduling properties.
The targets and processes are listed in a tree:
- Connection Information
- Malloc Information
- Memory Information
- Process Information
- Signal Information
- reversing the sorting order (
- disabling or re-enabling auto-refresh
(
 )
) - manually refreshing the display
(
 )
) - starting or configuring kernel event tracing
(
 )
) - creating a new target connection
(
 )
) - minimizing and maximizing the view
Sending a signal
The Target Navigator view lets you send signals to the processes on a connected target. For example, you can terminate a process by sending it a SIGTERM signal.
- In the Target Navigator view, expand the target, then right-click a process and select Deliver Signal.
- In the Deliver Signal dialog, select a signal from the dropdown menu.
- Click OK.
Interacting with targets
You can interact with targets by right-clicking their entries and using the context menu.
This menu allows you to refresh a target's process list, delete its connection, or create a new connection.
You can also launch a Telnet session, start a kernel event trace, capture the list of target processes,
manage adaptive partitions settings, and view the target connection properties:
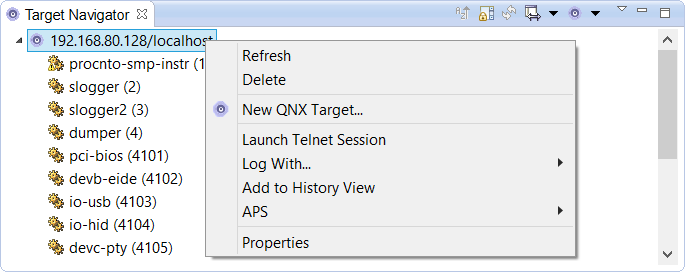
The Log With option lets you run a kernel event trace. When the trace finishes, the IDE presents the captured data as a target in the System Information History view. The Add to History View option copies the current list of target processes to a new entry in this same view. From the APS submenu, you can configure the adaptive partitioning scheduler, as described below in "Configuring APS". Finally, the Properties option opens the QNX Qconn Target panel for configuring the target connection.
Interacting with processes
When you right-click a process entry, you see different context menu options than for targets:
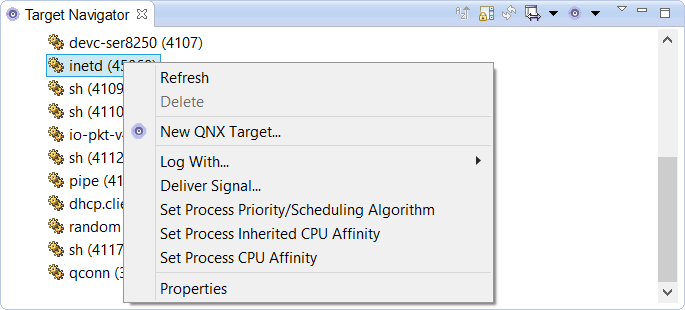
Some target-level operations are accessible from the process-level menu. These include refreshing the process list, creating a connection, launching a kernel event trace, and displaying the target properties.
The middle portion of the menu shows options for interacting with processes. For example, the Deliver Signal option lets you send a signal. You can explicitly terminate a process by selecting Slay. There are also options to adjust a process's priority and its inherited and non-inherited CPU affinities.
Each of these process options opens a popup window for setting the corresponding property. For information about scheduling priorities and policies, see the "Thread scheduling" section in the System Architecture guide. For information about the CPU affinity settings that associate threads with a particular core, see the "Thread affinity" section in the Multicore Processing User's Guide.
Configuring APS
- Set APS Security
- This option opens a popup window that provides checkboxes for enabling APS security flags. These flags determine who can add partitions and modify their attributes, and are described in the "Security" section for the SchedCtl() entry in the Utilities Reference.
- Note that after you set a flag, you can't unset it through this window, so the flag doesn't appear anymore. To unset it, you must reboot the target.
- Set APS Parameters
- The popup window opened by choosing this option lets you modify the length of the averaging window, which is the time interval used to calculate CPU usage, and enable specific bankruptcy flags, which determine how the system reacts when a partition exhausts its critical budget and hence, becomes bankrupt; these flags are described in the "Handling bankruptcy" section for the SchedCtl() entry.
- Note that after you set a flag, you can't unset it through this window, so the flag doesn't appear anymore. To unset it, you must reboot the target.
- Modify Existing Partition
- This option lets you select a partition and set its budget and critical budget. The first setting is a percentage of CPU usage while the second is in milliseconds.
- Create New Partition
- Choosing this option opens a window into which you can enter a name, parent partition, budget, and critical budget to create a new partition. The new partition's budget is taken from its parent's budget.
Viewing historical target data
When you capture the current list of target processes or a kernel event trace finishes,
the IDE presents the captured data as a new target entry in the System Information History
view. This view behaves the same way as the Target Navigator view; selecting a target or one or more processes causes
other System Information views to show the corresponding data.
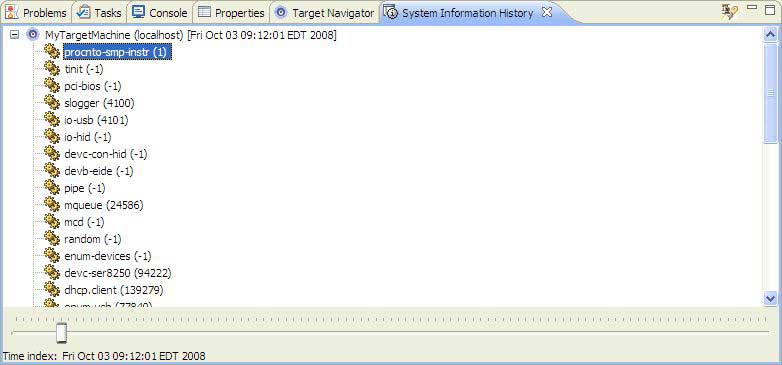
To view the captured data in continuous mode, drag the time index slider at the bottom of the view. The System Information views are updated as you change the slider's position, to show the data for that exact point in time.
To view a log file from a previous kernel event trace, click the Search log files button (
In the Open System Information Log File dialog, you can set search paths for the IDE to find log files, and you can load these log files into the QNX System Information perspective. By default, any log files generated from existing log configurations that you've used are shown. To load a log file, select it in the tree, then click Open Log. The file's data then appears as a new target in the view.