Importing Memory Analysis data is useful in two cases: If it isn't possible to start a Memory Analysis session using the
IDE (e.g., when there is no network connection between the host and target machines), or
if qconn isn't running on the target machine. In these cases, you can start an analysis session
on the target (see Launching from the command line with Memory Analysis) and then transfer the data file to your host to perform
a postmortem analysis.
If you want to share a session, you can export it in XML format, so it can later be imported to view the data.
To import Memory Analysis data:
-
Click .
-
Select , then click Next.
-
In the Input File field in the Import Memory Analysis Data window,
specify the file containing the data that you're importing.
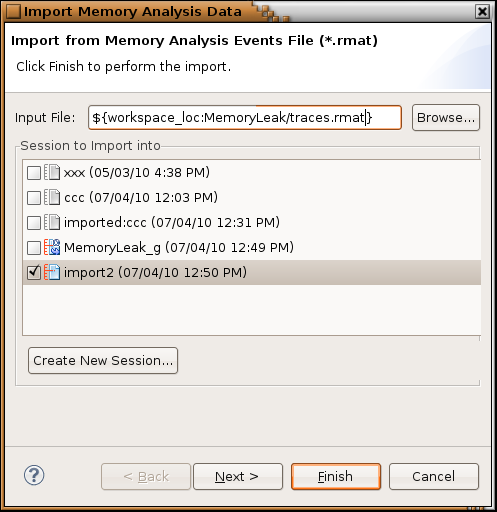
You can enter an absolute host path or click Browse to open a window
that lets you choose a workspace or local file, using a file selector. When providing a name,
you can use ${workspace_loc:*} to specify the current workspace; for example:
${workspace_loc:project_name/results_file}.
The filename must end with a .xml or .rmat extension.
When importing logs (.rmat files), you must pick a session for storing the data
and optionally, specify the paths of the binary files, by following the next two steps.
For XML files, skip to Step 6.
-
Select a session for storing the log data.
In this window, the Memory Analysis sessions are listed from oldest (at the top) to newest (at the bottom),
with checkboxes that let you select just one session. Note that the session you select must be open.
There's also a Create New Session button, if you want to store the log in its own session.
- Optional:
Click Next to proceed to the Binary Path dialog, then specify
the executable binary and any shared libraries that ran during the analysis session.
To see line numbers in the event data (including the stack traces), you must have copies of the executable binary
and library files with debug symbols on your host machine.
Next to the Select executable file text field, you can click Browse
to open a popup window that lets you choose a workspace or local filesystem directory.
The text field gets populated when you make your selection, for example:
${workspace_loc:HelloWorld/build/x86-debug/HelloEarth}
The Libraries Search Path panel lists the paths that the IDE should search to find
shared libraries referenced by memory event data.
The Source Lookup Path panel lists the paths that the IDE should search to find
source code that's related to memory events but wasn't compiled on the host.
You don't need to define these paths if your source code was built on the host.
-
Click Finish to perform the import.
When the importing process completes, you can open the Memory Analysis session to view the results.