![[Previous]](prev.gif) |
![[Contents]](contents.gif) |
![[Index]](keyword_index.gif) |
![[Next]](next.gif) |
![[Previous]](prev.gif) |
![[Contents]](contents.gif) |
![[Index]](keyword_index.gif) |
![[Next]](next.gif) |
This chapter includes:
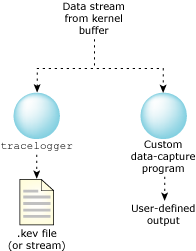
The program that captures data is the “messenger” between the instrumented kernel and the filesystem.

Possible data capture configurations.
The main function of the data-capture program is to send the buffers given to it by the instrumented kernel to an output device (which may be a file or something else). In order to accomplish this function, the program must also:
You must configure the instrumented kernel before logging. The instrumented kernel configuration settings include:
 |
The instrumented kernel retains the settings, and multiple programs access a single instrumented kernel configuration. Changing the settings in one process supersedes the settings made in another. |
We've provided tracelogger as the default data-capture utility. Although you can write your own utility, there's little need to; if you do, the quickest approach is to tailor the tracelogger code to suit your own needs.
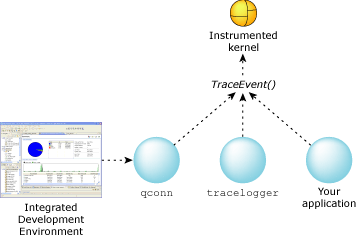
You can control the capture of data via qconn (under the control of the IDE), tracelogger (from the command line), or directly from your application. All three approaches use the TraceEvent() function to control the instrumented kernel:

Controlling the capture of trace data.
For information about controlling the trace from the IDE, see the Analyzing Your System with Kernel Tracing chapter of the IDE User's Guide.
Let's look first at using tracelogger, and then we'll describe how you can use TraceEvent() to control tracing from your application.
 |
|
The options that you use when you start tracelogger affect the way that the instrumented kernel logs events and how tracelogger captures them. In this section, we'll look at:
You can use tracelogger's command-line options to manage the instrumented kernel's buffers, specifying:
You can also specify the number of buffers that tracelogger itself uses.
For more information, see the entry for tracelogger in the Neutrino Utilities Reference.
You can run tracelogger in several modes — depending on how and what you want to trace — by specifying the following command-line options:
In ring mode, tracelogger doesn't capture the events until it gets a SIGINT signal (e.g. you press Ctrl-C), or an application calls TraceEvent() with a command of _NTO_TRACE_STOP.
If you don't specify the -r option, tracelogger runs in linear mode; every filled-up buffer is captured and flushed immediately.
 |
In daemon mode, tracelogger ignores any other options, unless you also specify the -E option to use extended daemon mode. |
All of the above, except for daemon mode, constitute normal mode. In normal mode, you configure, start, and stop the tracing from the command line; in daemon (-d1) mode, your application must do everything from code. However, if you also use the -E option, you get the best of both modes: the command-line configuration of normal mode, and the full control of daemon mode.
Here's an outline of the strengths, weaknesses, and features of these modes:
| Feature | Normal mode | Daemon mode | Extended daemon mode |
|---|---|---|---|
| tracelogger support | Full | Limited | Full |
| Controllability | Limited | Full | Full |
| Events recorded by default | All | None | All |
| Configuration difficulty | Easy | Harder | Easy |
| Configuration method | Command line only | User program, using calls to TraceEvent() | Command line and user program |
| Logging starts | Instantaneously | Through a user program; also calls to TraceEvent() | Through a user program; also calls to TraceEvent() |
For a full description of the tracelogger utility and its options, see its entry in the Neutrino Utilities Reference.
By default, the instrumented kernel and tracelogger collect data in fast mode; to switch to wide mode, specify the -w option when you start tracelogger.
The tracelogger utility gives you some basic control over filtering by way of its -F option. This filtering is limited to excluding entire classes of events at a time; if you need a finer granularity, you'll need to use TraceEvent(), as described in the Filtering chapter in this guide.
By default, tracelogger captures all events from all classes, but you can disable the tracing of events from the classes as follows:
| To disable this class: | Specify: |
|---|---|
| Kernel calls | -F1 |
| Interrupt | -F2 |
| Process | -F3 |
| Thread | -F4 |
| Virtual thread | -F5 |
| Communication | -F6 |
| System | -F7 |
You can specify more than one filter by using multiple -F options. Note that you can't disable the Control or User classes with this option. For more information about classes, see the Events and the Kernel chapter of this guide.
Because the circular linked list of buffers can't hope to store a complete log of event activity for any significant amount of time, the tracebuffer must be handed off to a data-capture program. Normally the data-capture program pipes the information to either an output device or a file.
By default, the tracelogger utility saves the output in the binary file /dev/shmem/tracebuffer.kev, but you can use the -f option to specify a different path. The .kev extension is short for “kernel events”; you can use a different extension, but the IDE recognizes .kev and automatically uses the System Profiler to open such files.
You can also map the file in shared memory (-M), but you must then also specify the maximum size for the file (-S).
You don't have to use tracelogger to control all aspects of tracing; you can call TraceEvent() directly — which (after all) is what tracelogger does. Using TraceEvent() to control tracing means a bit more work for you, but you have much more control over specific details.
You could decide not to use tracelogger at all, and use TraceEvent() exclusively, but you'd then have to manage the buffers, collect the trace data, and save it in the appropriate form — a significant amount of work, although you can take advantage of the source code for tracelogger to help.
In practical terms you'll likely use tracelogger and TraceEvent() together. For example, you might run tracelogger in daemon mode, to take advantage of its management of the trace data, but call TraceEvent() to control exactly which events to trace.
The TraceEvent() kernel call takes a variable number of arguments. The first is always a command and determines what (if any) additional arguments are required.
In this section, we'll discuss:
For reference information about TraceEvent(), see the QNX Neutrino Library Reference. The source code for tracelogger might also help you.
As mentioned above, you can use TraceEvent() to manage the instrumented kernel's buffers, but it's probably easier to run tracelogger in daemon mode and let it look after the buffers. Nevertheless, here's a summary of how to do it with TraceEvent():
TraceEvent(_NTO_TRACE_ALLOCBUFFER, uint bufnum, void** linkliststart);
Allocated trace buffers can store 1024 simple trace events.
 |
Your application must run as root in order to use this command. |
TraceEvent(_NTO_TRACE_DEALLOCBUFFER);
All events stored in the trace buffers are lost.
TraceEvent(_NTO_TRACE_FLUSHBUFFER);
num_events = TraceEvent(_NTO_TRACE_QUERYEVENTS);
TraceEvent() doesn't support the different modes of operation that tracelogger does; your application has to indicate when to start tracing, how long to trace for, and so on:
TraceEvent(_NTO_TRACE_START);
TraceEvent(_NTO_TRACE_STARTNOSTATE);
These commands are similar, except that _NTO_TRACE_STARTNOSTATE suppresses the initial system state information (which includes thread IDs and the names of processes).
TraceEvent(_NTO_TRACE_STOP);
You can decide whether to trace until you've gathered a certain quantity of data, trace for a certain length of time, or trace only during an operation that's of particular interest to you. After stopping the trace, you should flush the buffer by calling:
TraceEvent(_NTO_TRACE_FLUSHBUFFER);
TraceEvent(_NTO_TRACE_SETRINGMODE);
As described earlier in this chapter, in ring mode the kernel stores all events in a circular fashion inside the linked list without flushing them.
TraceEvent(_NTO_TRACE_SETLINEARMODE);
When you use this mode, every filled-up buffer is captured and flushed immediately.
You can select events in an additive or subtractive manner; you can start with no events, and then add specific classes or events, or you can start with all events, and then exclude specific ones. We'll discuss using TraceEvent() to filter events in the Filtering chapter.
TraceEvent() gives you much finer control over wide and fast mode than you can get with tracelogger, which can simply set the mode for all events in all traced classes. Using TraceEvent(), you can set fast and wide mode for all classes, a specific class, or a specific event in a class:
TraceEvent( _NTO_TRACE_SETALLCLASSESWIDE );
TraceEvent( _NTO_TRACE_SETALLCLASSESFAST );
TraceEvent(_NTO_TRACE_SETCLASSFAST, int class);
TraceEvent(_NTO_TRACE_SETCLASSWIDE, int class);
For example:
TraceEvent(_NTO_TRACE_SETCLASSWIDE, _NTO_TRACE_KERCALLENTER);
TraceEvent(_NTO_TRACE_SETEVENTFAST, int class, int event)
TraceEvent(_NTO_TRACE_SETEVENTWIDE, int class, int event)
For example:
TraceEvent(_NTO_TRACE_SETEVENTFAST, _NTO_TRACE_KERCALLENTER,
           __KER_INTERRUPT_ATTACH);
You can even use TraceEvent() to insert your own events into the trace data. You can call TraceEvent() directly (see below), but it's much easier to use the following convenience functions:
If you want to call TraceEvent() directly, use one of the following commands:
For more information, see the entry for TraceEvent() in the QNX Neutrino Library Reference.
![[Previous]](prev.gif) |
![[Contents]](contents.gif) |
![[Index]](keyword_index.gif) |
![[Next]](next.gif) |