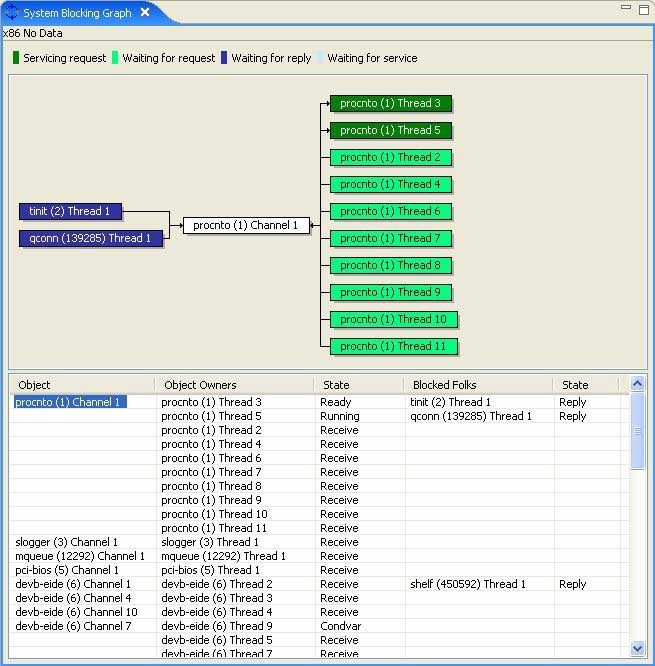
The System Blocking Graph view presents a color-coded display of all the active channels in the system and illustrates the interaction of threads with those channels.
Interaction with resource objects are such that a thread can be blocked waiting for access to the resource or waiting for servicing (i.e. the thread is SEND-blocked on a channel).
The thread could also be blocked waiting for a resource to be released back to the thread or waiting for servicing to terminate (i.e. the thread is REPLY-blocked).
Clients in such conditions are shown on the left side of the graph, and the resource under examination is in the middle. Threads that are waiting to service a request or are active owners of a resource, or are actively servicing a request, are shown on the right side of the graph:
In terms of classical QNX terminology, you can think of the items in the legend at the top of the graph like this:
| Legend item | Thread state |
|---|---|
| Servicing request | Not RECEIVE-blocked (e.g. RUNNING, blocked on a mutex, etc.) |
| Waiting for request | RECEIVE-blocked |
| Waiting for reply | REPLY-blocked |
| Waiting for service | SEND-blocked |