This mode shows a list of functions from the applications in your project.
Note: In Function Instrumentation mode, it doesn't show calls to functions, such as printf(), in the C library.
To access this table:
- From the toolbar menu in the Execution Time view, click the Show Table icon.

A list of functions for the selected profile is displayed in the Execution Time view.
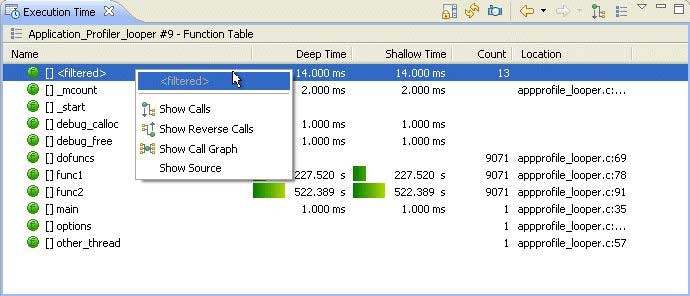
The Show Table Mode view.
From this table, select a function a right-click to Show Calls.