The Debug view shows the target debugging information in a tree hierarchy.
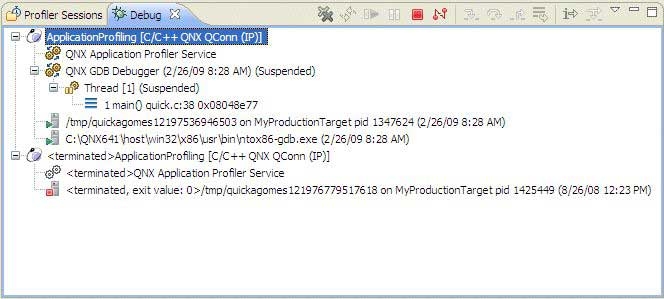
The Debug view.
The number displayed after a thread label is a reference counter, not a thread identification number (TID).
The IDE shows stack frames as child elements, and it shows the reason for the suspension beside the thread, (such as the end of the stepping range, a breakpoint was encountered, or a signal was received). When a program exits, the IDE also shows the exit code.