-
From the Disassembly view dropdown menu, select Go To
Address.
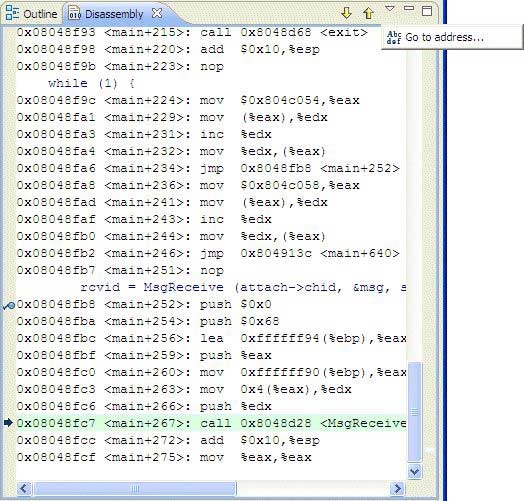
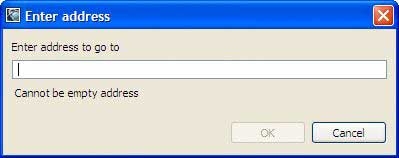
The Enter Address dialog appears.
-
Type a decimal or hexadecimal value of the memory address that you want to jump
to, and click OK.
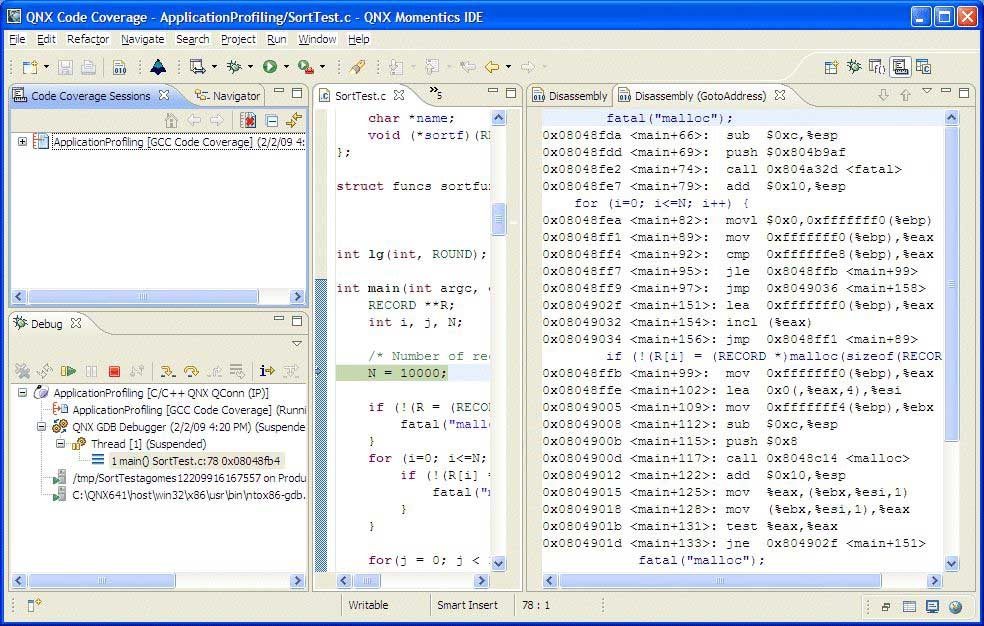
This action takes the memory address and creates a new Disassembly (Go To Address) view with a section of disassembly starting with the specified address.
To use this feature, you'll need to do the following:
- obtain the line number settings from to set the new disassembly block size
- find the memory address of the function to specify the hexadecimal or decimal
value to jump to
The secondary Disassembly (Go To Address) view shows the result from the Goto Address action, and the disassembly block in the view remains the same when you step through your debugging process.
- use the Up and Down arrows to add more of the disassembly block before or after the current page. Note that the incremented block size is set from using .
Besides the Debug view, you'll find several other useful views in the Debug perspective:
| To: | Use this view: |
|---|---|
| Inspecting variables | Variables |
| Using breakpoints and watchpoints | Breakpoints |
| Evaluating your expressions | Expressions |
| Inspecting your registers | Registers |
| Inspecting a process's memory | Memory |
| Inspecting shared-library usage | Modules |
| Monitoring signal handling | Signals |
| Viewing your output | Console |
| Interacting with GDB | Console |