The Partition Summary pane provides a summary of the entire log file, focused on QNX's adaptive partitioning technology. For each distinct configuration of partitions detected in the log file, the distribution of CPU usage used by those partitions is displayed, along with a tabular display showing the distribution of CPU usage per event owner per partition.
You can use this information in conjunction with the CPU Usage editor pane to drill down into areas of interest. This pane contains valid data only when the log file contains partition information, and the process and thread states are logged in wide mode (so the partition thread scheduling information is collected).
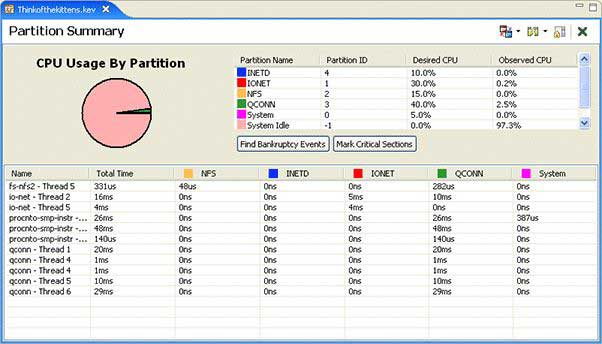
The System Profiler's Partition Summary pane.
You can also get snapshots of the usage of the adaptive partitioning on your system through the System Information perspective's System Profiler editor view. For more information, see the Getting System Information chapter.
Notice that this pane displays its summary information based on a time range selection specified in the Timeline pane. At the bottom of the pane, the Status Bar indicates for which time range the data is being presented. By default, you'll see partition information for the full event log range; however, you can use the toggle button in the toolbar of the pane to indicate that you want the information filtered for a specified range.