The Overview view () shows two charts spanning the entire log file range.
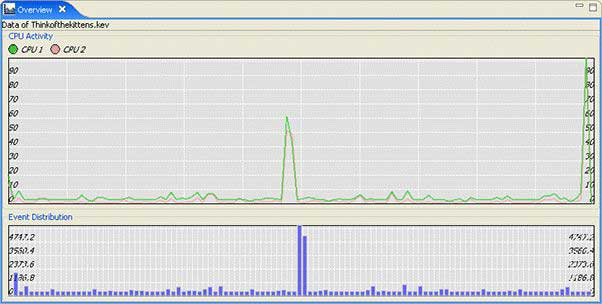
The System Profiler's Overview view.
These charts display the CPU usage (per CPU) over time and the volume of events over time. The Overview reflects the current state of the active editor and active editor pane. You can select an area of interest in either one of the charts; then, using the right-click menu, zoom in to display only that range of events to quickly isolate areas of interest due to abnormal system activity.