The Raw Event Data view () lets you examine the data payload of a particular selected event. It shows a table of event data keys and their values. For example if an event is selected in the Trace Log view, rather than attempting to look at all of the data in the single line entry, you can open the Raw Event Data view to display the data details more effectively.
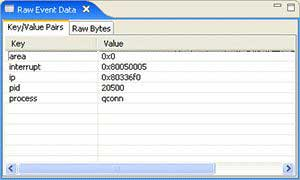
The System Profiler's Raw Event Data view.