The following views in the QNX System Information perspective are especially useful for examining the memory of your target system:
- Malloc Information view
- Finding memory errors and leaks
Malloc Information view
The Malloc Information view shows statistical information from the general-purpose, process-level memory allocator:
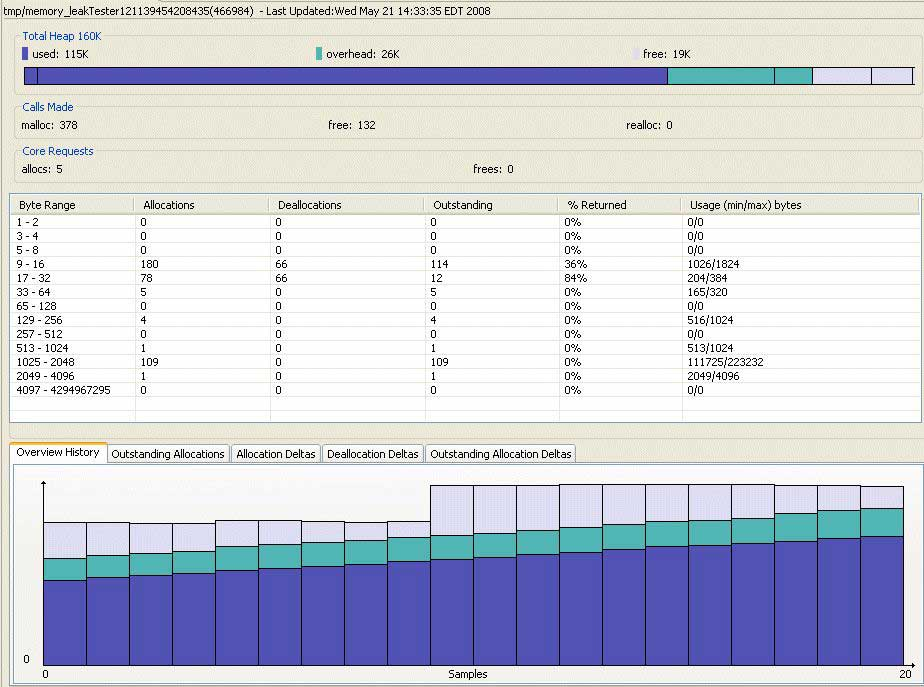
When you select a process in the Target Navigator view, the IDE queries the target system and retrieves the allocator's statistics. The IDE gathers statistics for the number of bytes that are allocated, in use, as well as overhead.
The view includes the following panes:
Total Heap
- used (dark blue)
- overhead (turquoise)
- free (lavender)
The Total Heap number in the Malloc Information view is an accurate number that the IDE gets from the libmalloc library; however, the heap size number in the Memory Information view and System Resource view is an estimated number. To get the actual heap size allocated by a process, see the Malloc Information view. To get an overview about what the memory allocation pattern looks like for a process, see the Memory Information view.
The bar chart shows the relative size of each heap.
Calls Made
The Calls Made pane shows the number of times a process has allocated, freed, or reallocated memory by calling malloc , free , and realloc functions. (See the Neutrino Library Reference.)
Core Requests
The Core Requests pane shows the number of allocations that the system allocator automatically made to accommodate the needs of the program you selected in the Target Navigator view. The system allocator typically dispenses memory in increments of 4 KB (one page).
The number of allocations never equals the number of deallocations, because when the program starts, it allocates memory that isn't released until it terminates.
Distribution
The Distribution pane shows a distribution of the memory allocation sizes. The pane includes the following columns:
- Byte Range
- The size range of the memory blocks.
- Allocations
- The total number of calls that allocate memory.
- Deallocations
- The total number of calls that free memory.
- Outstanding
- The remaining number of allocated blocks. The value is equal to the number of allocated blocks minus the number of deallocated blocks.
- % Returned
- The ratio of freed blocks to allocated blocks, expressed as a percentage. The value is calculated as the number of deallocations divided by the number of allocations.
- Usage (min/max)
- The calculated minimum and maximum memory usage for a byte range. The values are calculated by multiplying the number of allocated blocks by the minimum and maximum sizes of the range. For example, if the 65–128 byte range had two blocks allocated, the usage would be 130/160. You should use these values for estimated memory usage only; the actual memory usage usually lies somewhere in between.
History
The History pane shows a chronology of the heap usage shown in the Total Heap pane. The pane automatically rescales as the selected process increases its total heap.
The History pane updates the data every second, with a granularity of 1 KB. Thus, two 512-byte allocations made over several seconds trigger one update.
- In the Malloc Information view's title bar, click the dropdown menu button (
), followed by Show.
- Click the pane you want shown.