Double-clicking on a session name opens the Memory Analysis editor for the selected session.
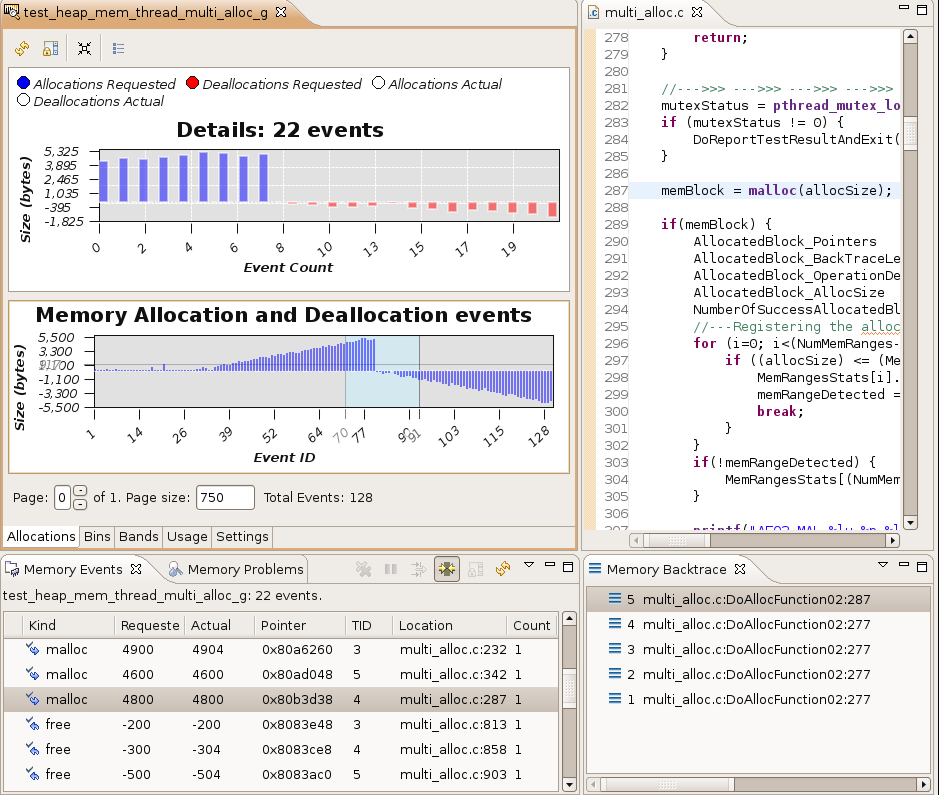
The top part of the editor shows the details for the data selected in the bottom part. The bottom part shows an overview of the entire memory analysis session data set:
Note: If the process does many allocations and deallocations, it could take some time for the traces and events to be registered, indexed, and shown.
The tabs at the bottom let you switch between several different data views:
- Allocations tab — trace information about allocations and deallocations.
- Bins tab — counters that track the general size of allocations and deallocations.
- Bands tab — counters that track the allocator's preallocated memory bands.
- Usage tab — information about the application's memory usage over time.
- Settings tab — settings for the running process.