On most systems, GDB has no special support for debugging programs that create additional processes using the fork() function. By default, when a program forks, GDB continues to debug the parent process, while the child process runs unimpeded. If you set a breakpoint in any code that the child then executes, the child will get a SIGTRAP signal that causes it to terminate (unless it catches the signal).
To debug the child process, include a call to sleep() in the code that the child process executes after the fork(). It may be useful to sleep only if a certain environment variable is set, or a certain file exists, so that the delay doesn't occur when you don't want to run GDB on the child. While the child is sleeping, use the ps program to get its process ID, and then instruct GDB to attach to the child process (use a new invocation of GDB if you're also debugging the parent process). From that point on, you can debug the child process like any other process that you attach to.
The modes available are:
- set follow-fork-mode mode
- Set the debugger response to a program call of fork() or vfork(). A call to fork() or vfork() creates a new process. If you want to follow the child process instead of the parent process, use this command. The type can be one of the following:
parent — The original process is debugged after a fork(). The child process runs unimpeded. This type is the default.
child — The new process is debugged after a fork(). The parent process runs unimpeded.
ask — The debugger will prompt you for either parent or child.
- show follow-fork-mode
- Display the current debugger response to a fork() or vfork() call.
If you ask to debug a child process and a vfork() is followed by an exec(), GDB executes the new target up to the first breakpoint encountered in the new target. If there's a breakpoint set on main() in your original program, the breakpoint will also be set on the main() function for the child process.
When a child process is spawned by vfork(), you can't debug the child or parent until an exec() call completes.
If you issue a run command to GDB after an exec() call executes, the new target restarts. To restart the parent process, use the file command with the parent executable name as its argument.
You can use the catch command to make GDB stop whenever a fork(), vfork(), or exec() call is made.
For additional information about catchpoints, see Adding breakpoints.
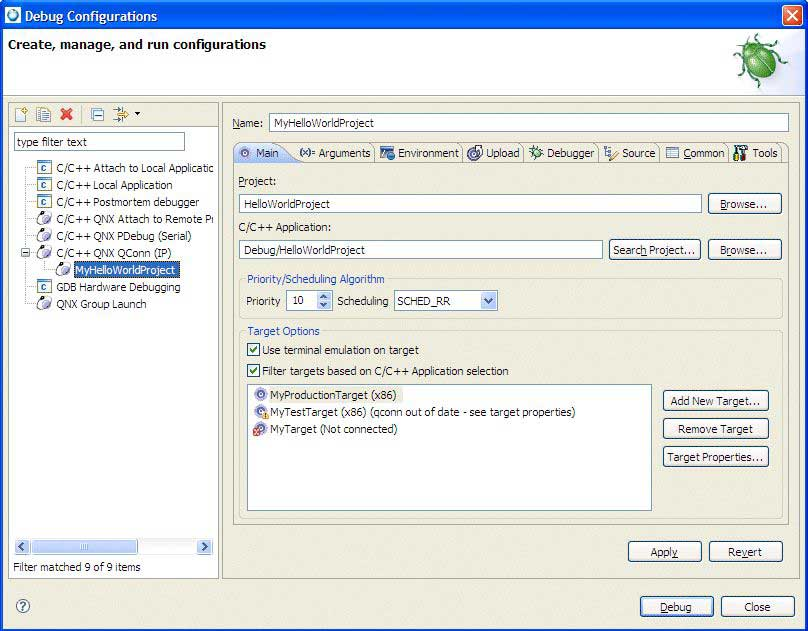
After building a debug-enabled executable, your next step is to create a launch configuration for that executable so you can run and debug it:
-
From the main menu, select (alternatively, you can select to open the dialog directly). You'll be prompted to select a configuration type for new projects.
The launch configuration dialog appears.
-
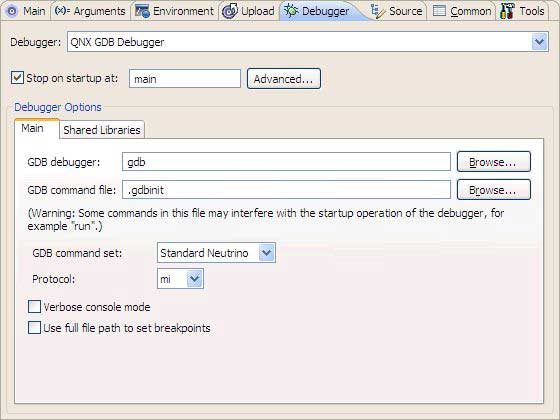
Select the Debugger tab.
The IDE changes to the Debug perspective.
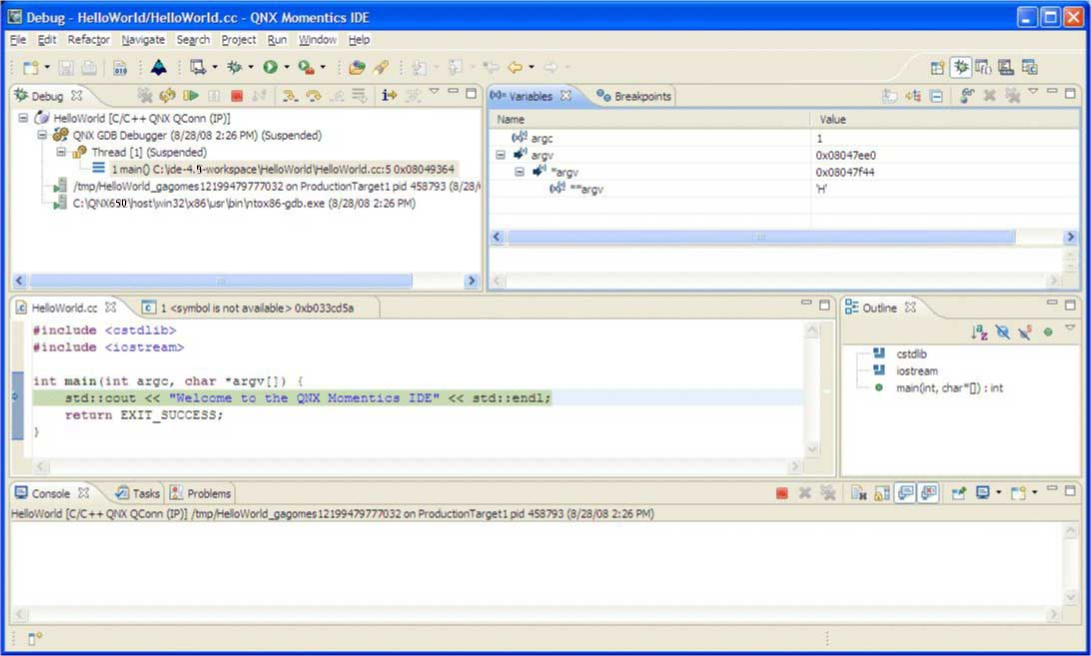
The default view of the Debug perspective for a simple HelloWorld QNX C++ project.
If launching a debugging session doesn't work when connected to the target with qconn, ensure that pdebug is on the target, and it is located in one of the directories in the PATH that qconn uses (typically /usr/bin).
- For serial debugging on a Windows host, the specification for the serial port has changed. When specifying a device name, you have to set COM1 instead of /dev/com1; otherwise, you'll receive an error similar to the following:
Debug session is not started - error:
Failed Launching Serial Debugger
Error initializing: /dev/com1: No such file or directory.
The device name /dev/com1 would no longer be considered a valid name for a device. You would instead set COM1 in the Serial Port option in Debug Launch Configuration dialog.
- The IDE automatically changes to the Debug perspective when you debug a program. If the default is no longer set, or if you wish to change to a different perspective when you debug, see the Running and debugging subsequent times section in the Launch Configurations Reference chapter.
- The IDE removes terminated debugging sessions from the Debug view when you launch a new session. This frees resources on your development host and your debugging target. You can retain the completed debug sessions by deselecting the Remove terminated launches when a new launch is created box in the pane of the Preferences dialog.