To view memory, in the Variables view, right-click a variable and select View Memory. The variables and their corresponding values show in the Memory view.
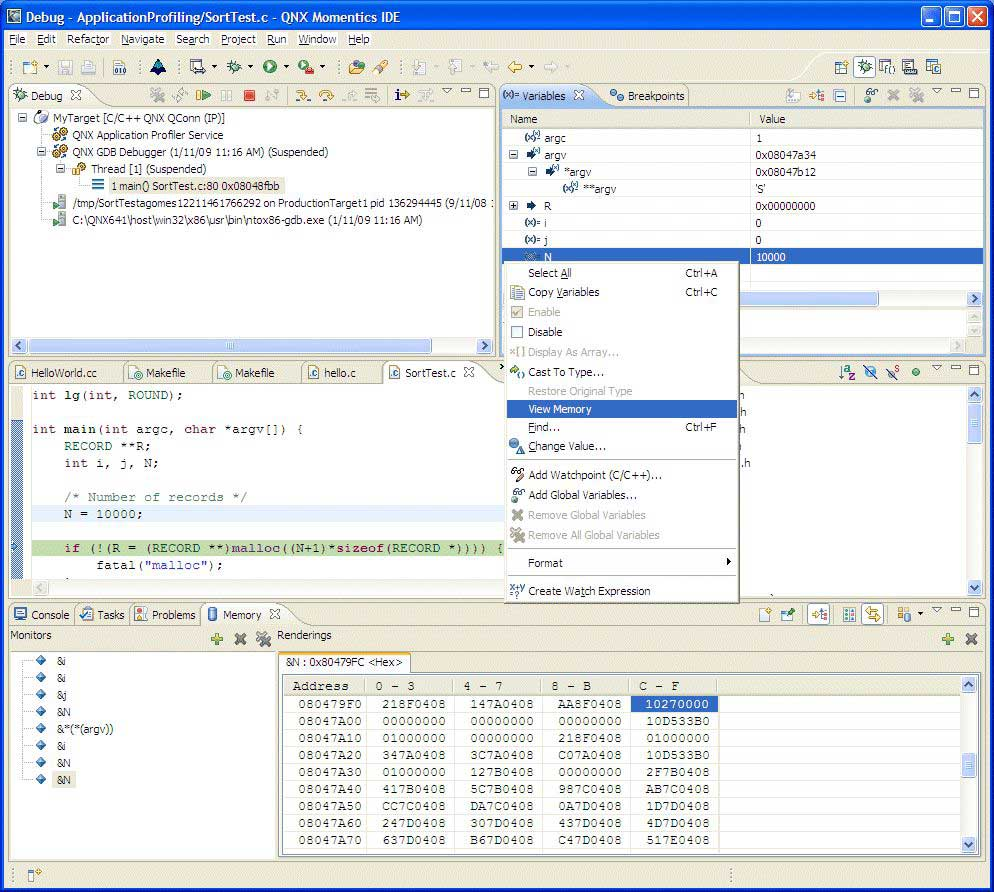
Viewing variables in memory.
The Memory view lets you monitor and modify your process memory, shown as a list of memory monitors that are represented as a section of memory specified by its location, then referred as a base address. Each memory monitor can be shown in different predefined data formats, called memory renderings. The debugger supports the following rendering types: hexadecimal (default), ASCII, signed integer, and unsigned integer. The default rendering is displayed automatically on the monitor creation.
The left pane of the Memory view is the Memory Monitors pane, which contains the list of memory monitors added to the debug session currently selected in the Debug view. The right pane of the Memory view is the Memory Renderings pane, and its content is controlled by your selection in the Memory Monitors pane. It consists of the tabs that show renderings.
The Go To Address field lets you enter a memory address to locate the source line or assembly code for the symbol.

For Windows host only, if the following error is displayed in the Memory view:
Target request failed: Unable to read memory.
turn off the automatic buffering option that causes the IDE to read memory beyond the accessible area:
- Open the Memory view menu (triangle).
- Select Table Renderings Preferences…, and then select Manual.
- Click OK.
Changing memory
To change a process's memory:
- Follow the procedures for inspecting a process's memory and configuring the output format.
- In the Memory view's Renderings pane, click in a cell, type the new value for the
memory, and then press one of the following:
- Enter to submit the change
- Esc to leave the memory unchanged
The changed memory appears in red.