It is important to know how much memory each individual process uses, otherwise you can spend considerable time trying to
optimize the heap. Therefore, you can use the System Information view to inspect the distribution and overall memory usage
for each process.
Note: In order to complete this task, the IDE must be currently running, you must have created a target project, and your target
host must be connected.
To inspect the process memory distribution:
-
On the All Processes tab, select a process.
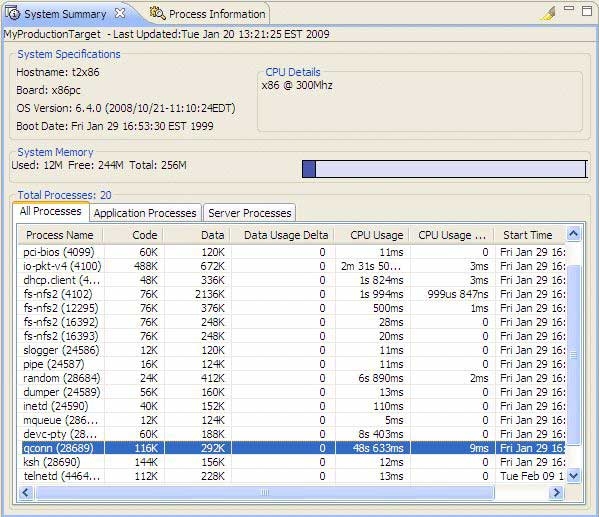
From this illustration, you can see how much physical memory the selected process occupies; in this example, it is 116 KB of Code, and 292 KB of Data.
-
In the Target Navigator view, expand your target and select the same process you selected earlier.
You can see a detailed map of the virtual memory for the process.
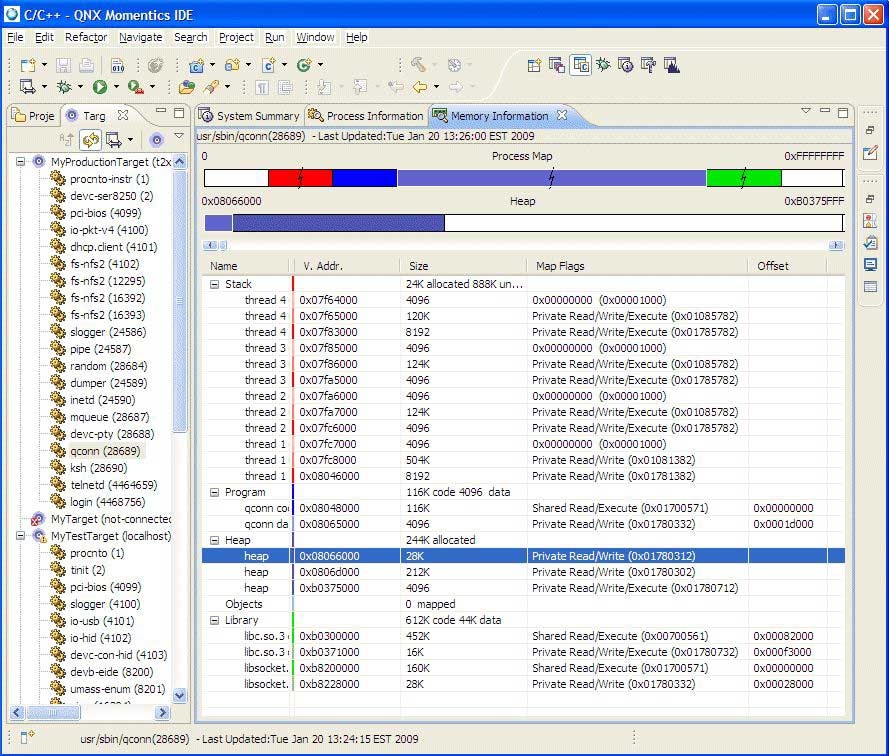
Based on the memory distribution information in the preceding example, you can determine if it is ideal to allocate time to
optimize the heap memory. If not, you might want to consider optimizing something else, such as the stack or static memory.