A call graph shows a visual representation of how the functions are called within the project.
To create a call graph for the selected profile:
- In the Execution Time view, right-click on a function and select Show Call Graphs from the menu.
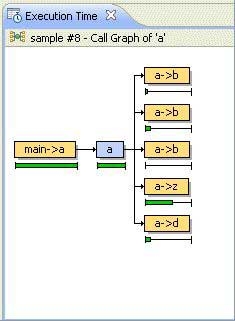
A simple example of a call graph.
This call graph shows a pictorial representation of the function calls. The selected function appears in the middle, in blue. On the left, in orange, are all of the functions that called this function. On the right, also in orange, are all of the functions that this function called.
To see the calls to and from a function:
- Click on a function directly in the call graph.
You can show the call graph only for functions that were compiled with profiling enabled.
If you position your cursor over a function in the graph, you will see Deep Time, Percent, and Count information for that function, if any.
For descriptions about these fields, see Column descriptions.